You can now filter pivot table data by any hierarchy value — directly from the dashboard, no reconfiguration needed.
How does this improves your life?
If you want track very specific data, now you just need to configure the filter once and keep an eye on it!
Examples:
- Dangerous waste from 1 specific facility
- Energy consumed from GdO or Solar Panels
- Scope 1+2 Carbon footprint emissions from 5 specific facilities
What changed?
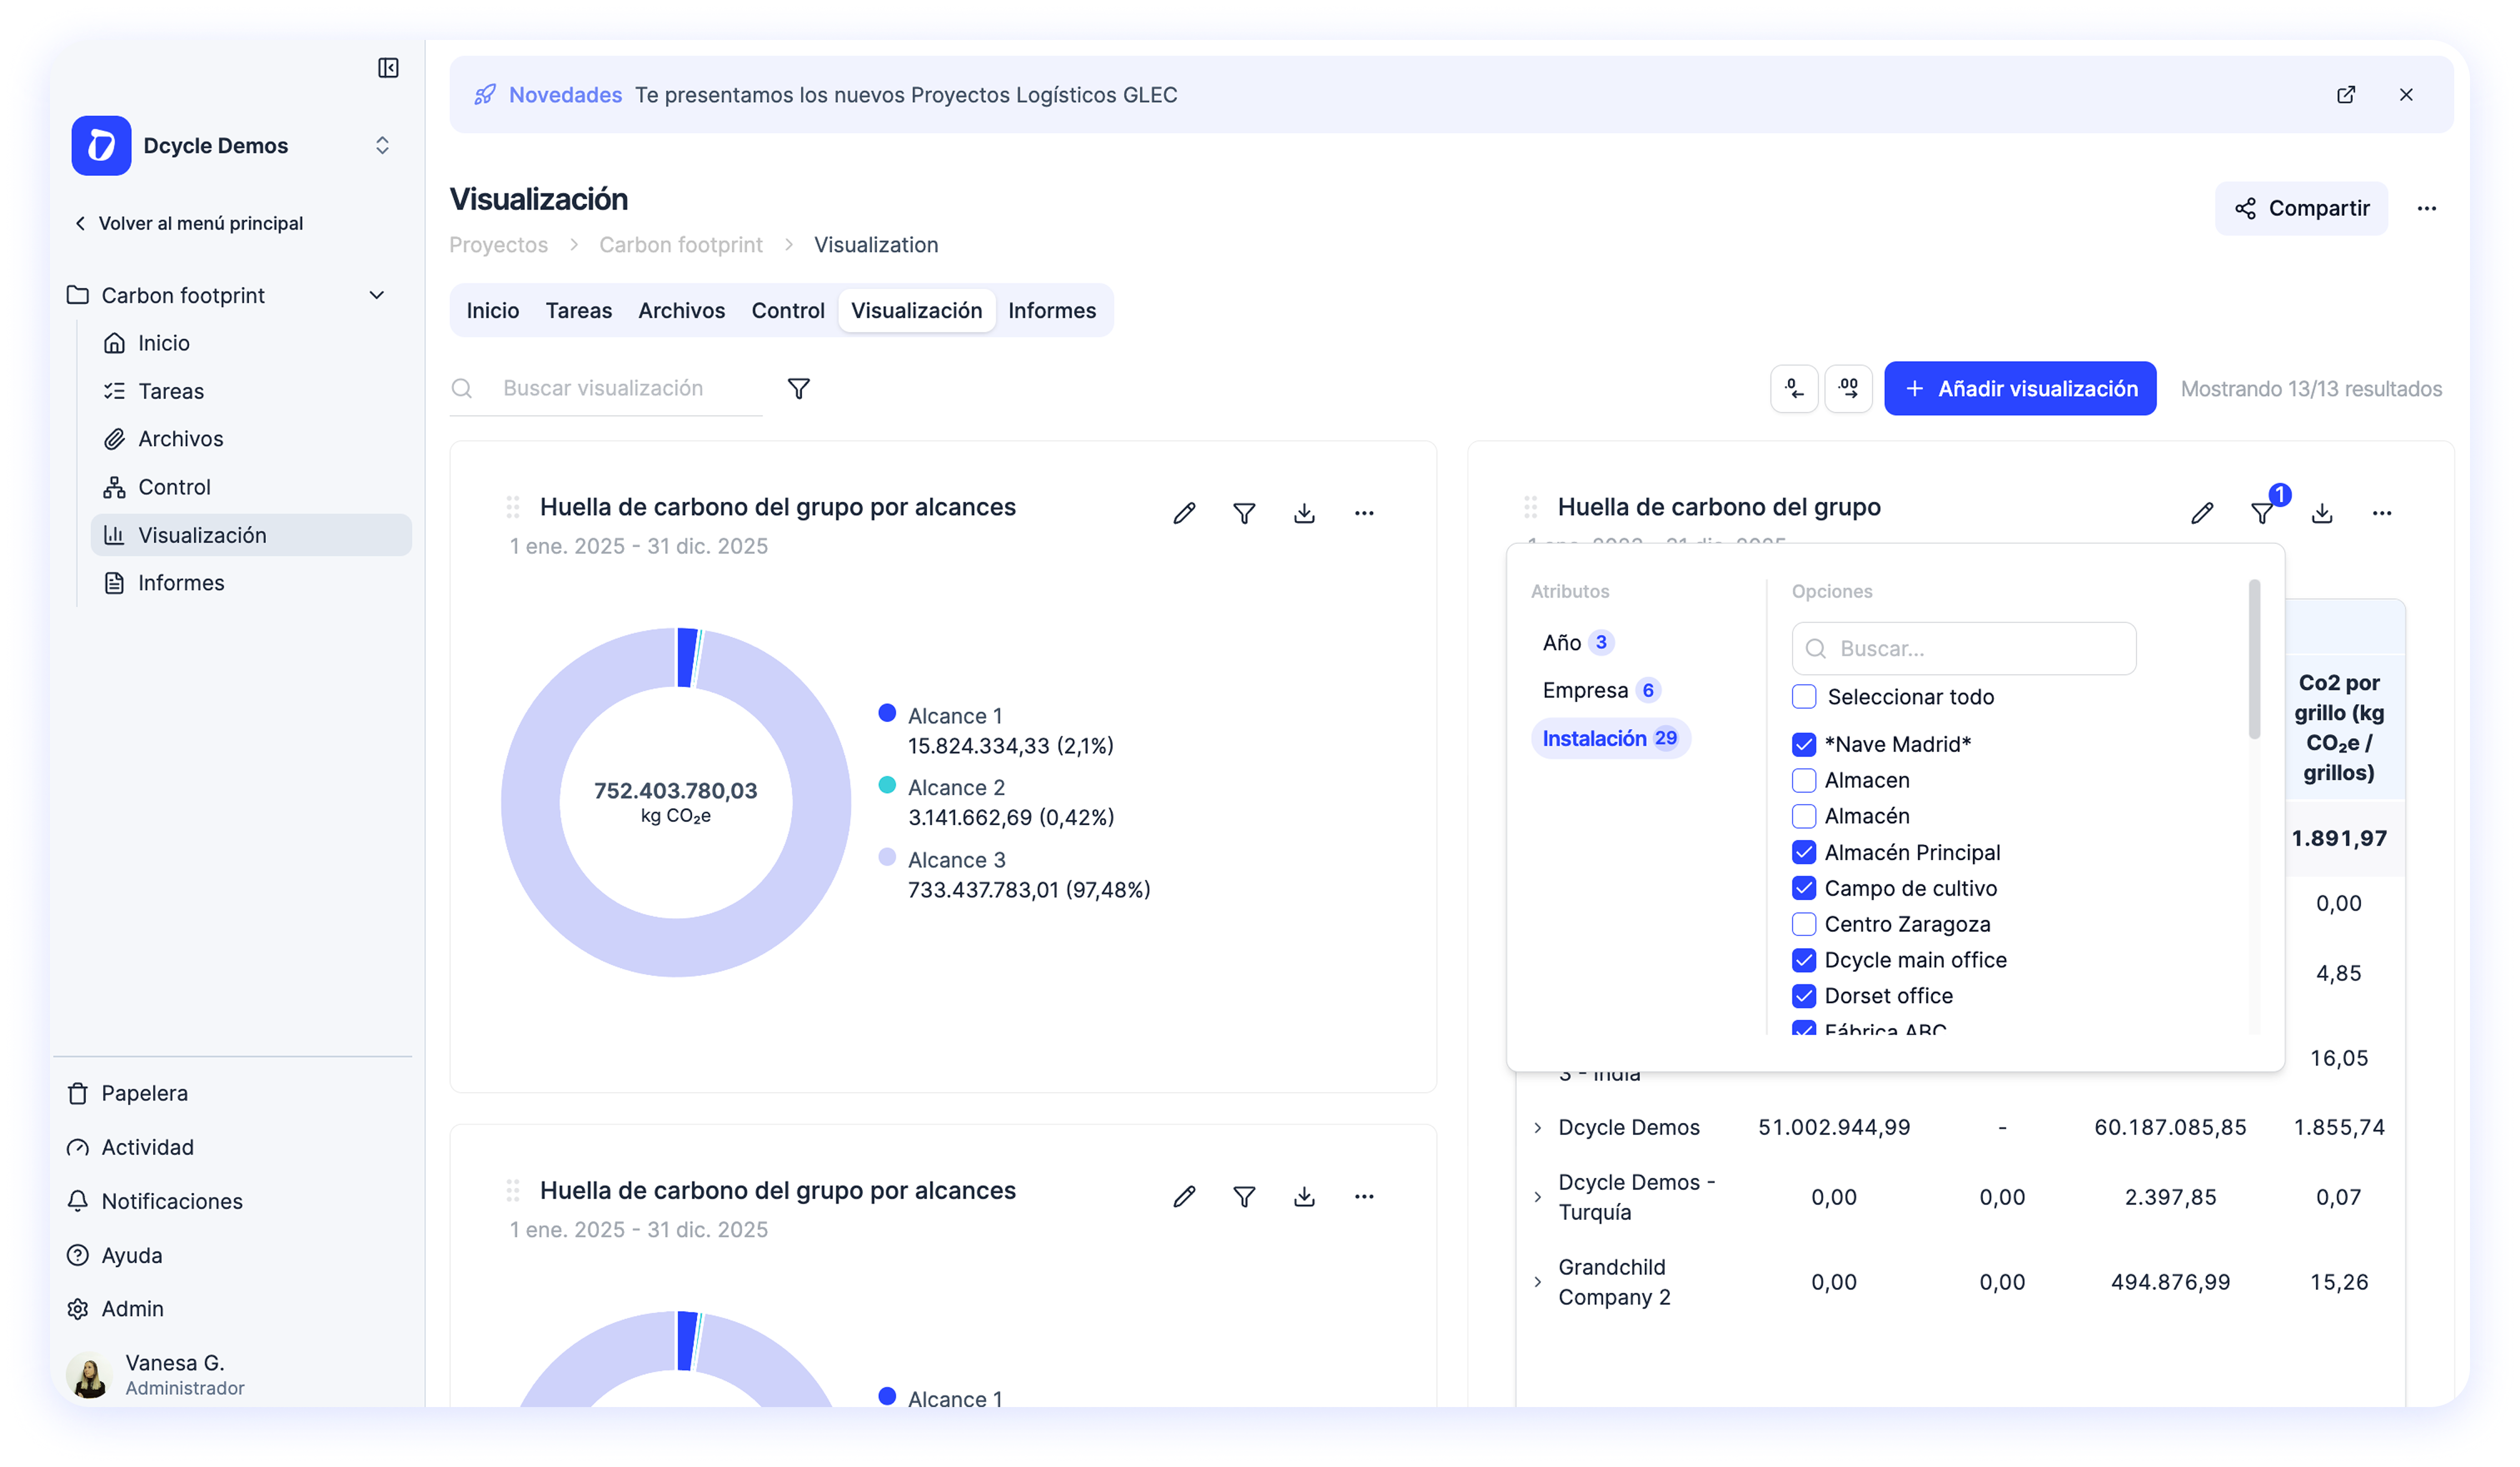
- Inline filter button on every pivot widget — click the filter icon to narrow data by facility, scope, country, fuel type, or any other hierarchy in your table
- Filter section in the config panel — set default filters when configuring a widget so it always opens with the right view
- Active filter badge — a count badge on the filter icon shows how many hierarchies have partial selections, so you always know when filters are active
- Smart filter persistence — filters are saved with the widget configuration and survive page reloads
- Automatic cleanup — removing a hierarchy from rows/columns automatically cleans up any filters that referenced it
For current clients
This is already live — no action needed. Open any pivot table widget on your dashboard and look for the new filter icon in the top-right toolbar. Click it, select the values you want to see, and the table updates instantly.
For everyone else
Want to see how Dcycle’s advanced pivot tables can help you analyze your sustainability data? Reach out to your Customer Success contact and we’ll walk you through it.