You can now analyse employee remuneration and gender salary gaps directly in the pivot table dashboard.
What changed?
- New pivot table category: Remuneration & Wage Gap — available under Social categories for all organizations
- Three measures available:
- Five hierarchies: Company, Year, Country, Gender, Job Category
- Fiscal year support — toggle between natural year and fiscal year grouping (if your organization has a non-January fiscal year start)
- Financial consolidation — all three measures support operational and financial (participation-weighted) views
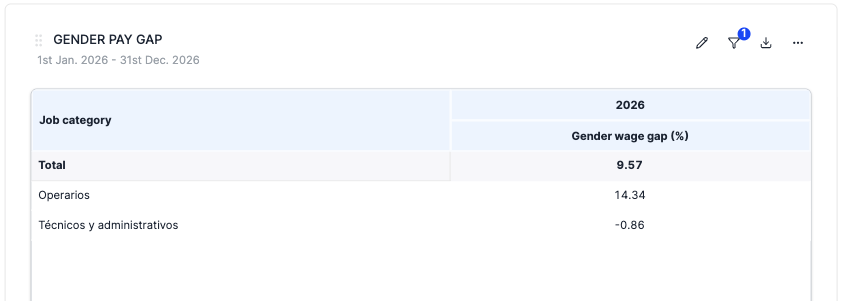
How does the wage gap calculation work?
Unlike simple averages, the wage gap is computed from the underlying employee data at every level. This means parent-level totals (e.g. by country or company) reflect the true weighted gap, considering the number of employees (FTEs) per group — not an average of the averages shown in the table.
Pro tip:
Create a custom row or column attribute to define age groups and build your table to your liking.