

How does it work?
- Pivot tables for Carbon Footprint using ISO 14064 format → build tables based on its verifiable structure: categories, subcategories, and activities.
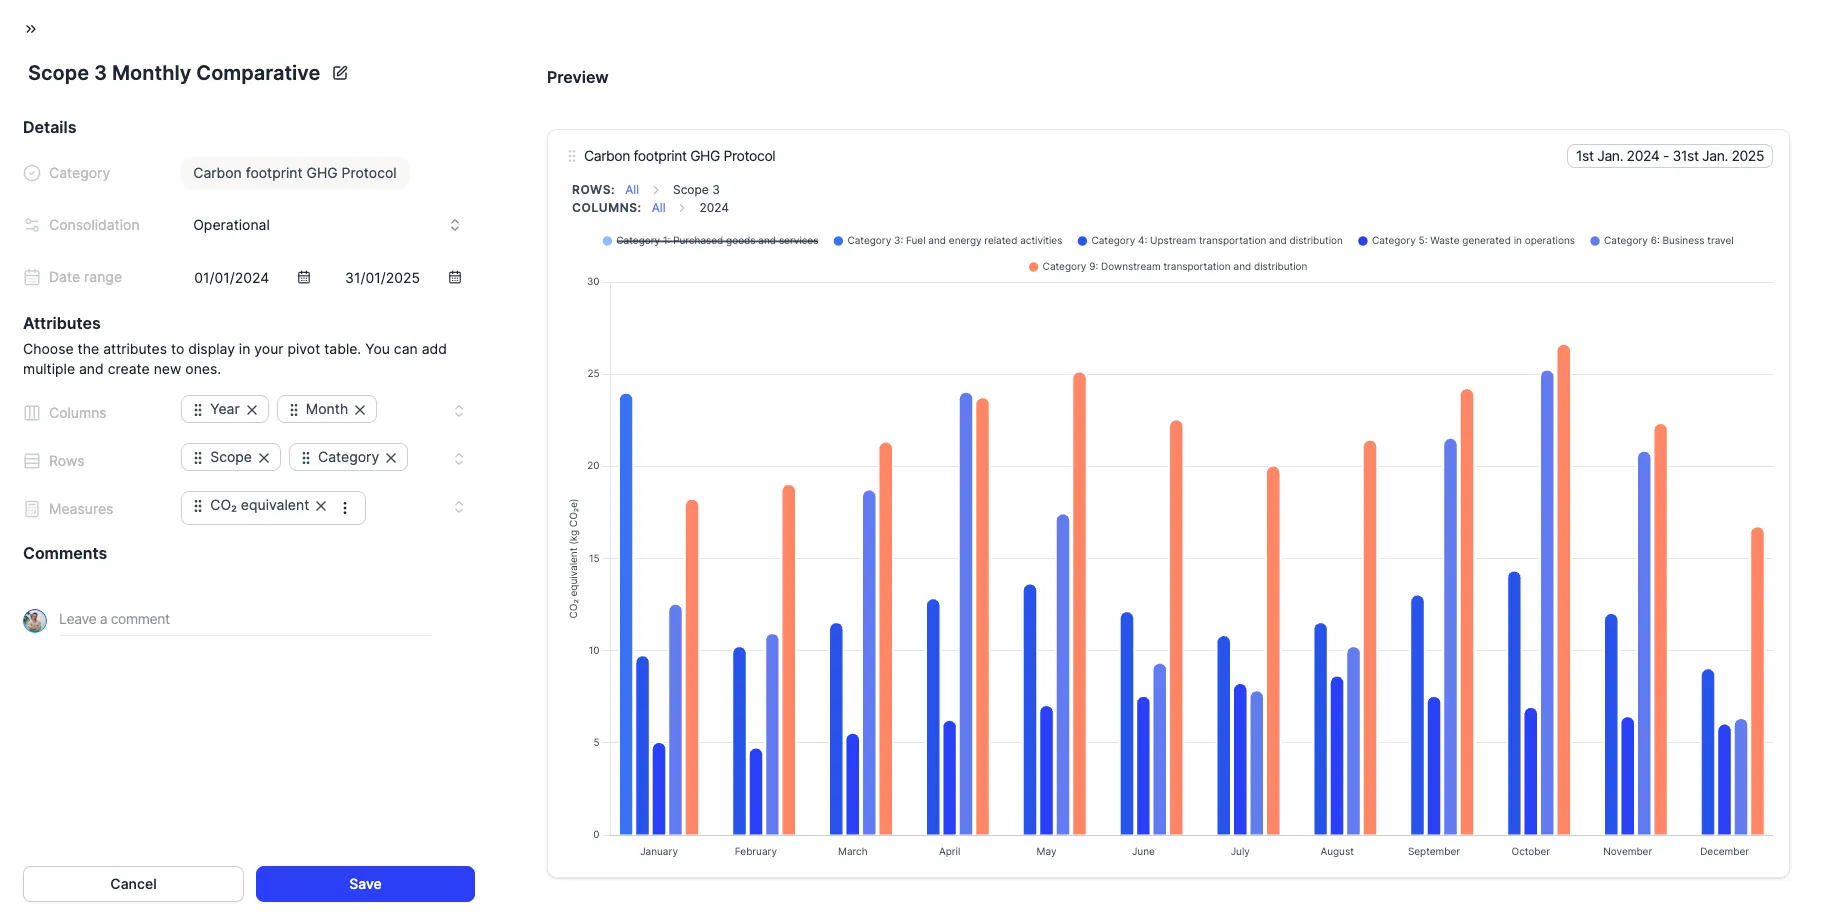
- Pivot tables for GHG Protocol → Scopes and categories now reflect the standard exactly, with more detail to understand what’s included in each subcategory.
- Example of automatic breakdown:
More KPIs coming soon to pivot tables: Carbon footprint with ISO 14064 categories, Waste, Social KPIs…
Exploit your metrics in Dcycle:
- 📊 Visualizations: Build comparative tables across child organizations or between specific categories/subcategories.
- 📄 Reports: Export or include these new structures in your reports and corporate analyses.
ℹ️ **Consolidation. Customization. Control. Detail. **Remember that if you need help, you can write to us at clients@dcycle.io and we’ll guide you.