
Introducing the Life Cycle Assessment (LCA) Dashboard.
You can now analyze the environmental impact of your products in a visual, intuitive way: broken down by life-cycle stages according to the EN 15804 standard: raw materials (A1), transport (A2), manufacturing (A3), distribution (A4), operational energy use (B6), and operational water use (B7).
The dashboard includes:
- Total impact with the corresponding unit of measurement
- Donut chart showing the breakdown by life-cycle stage
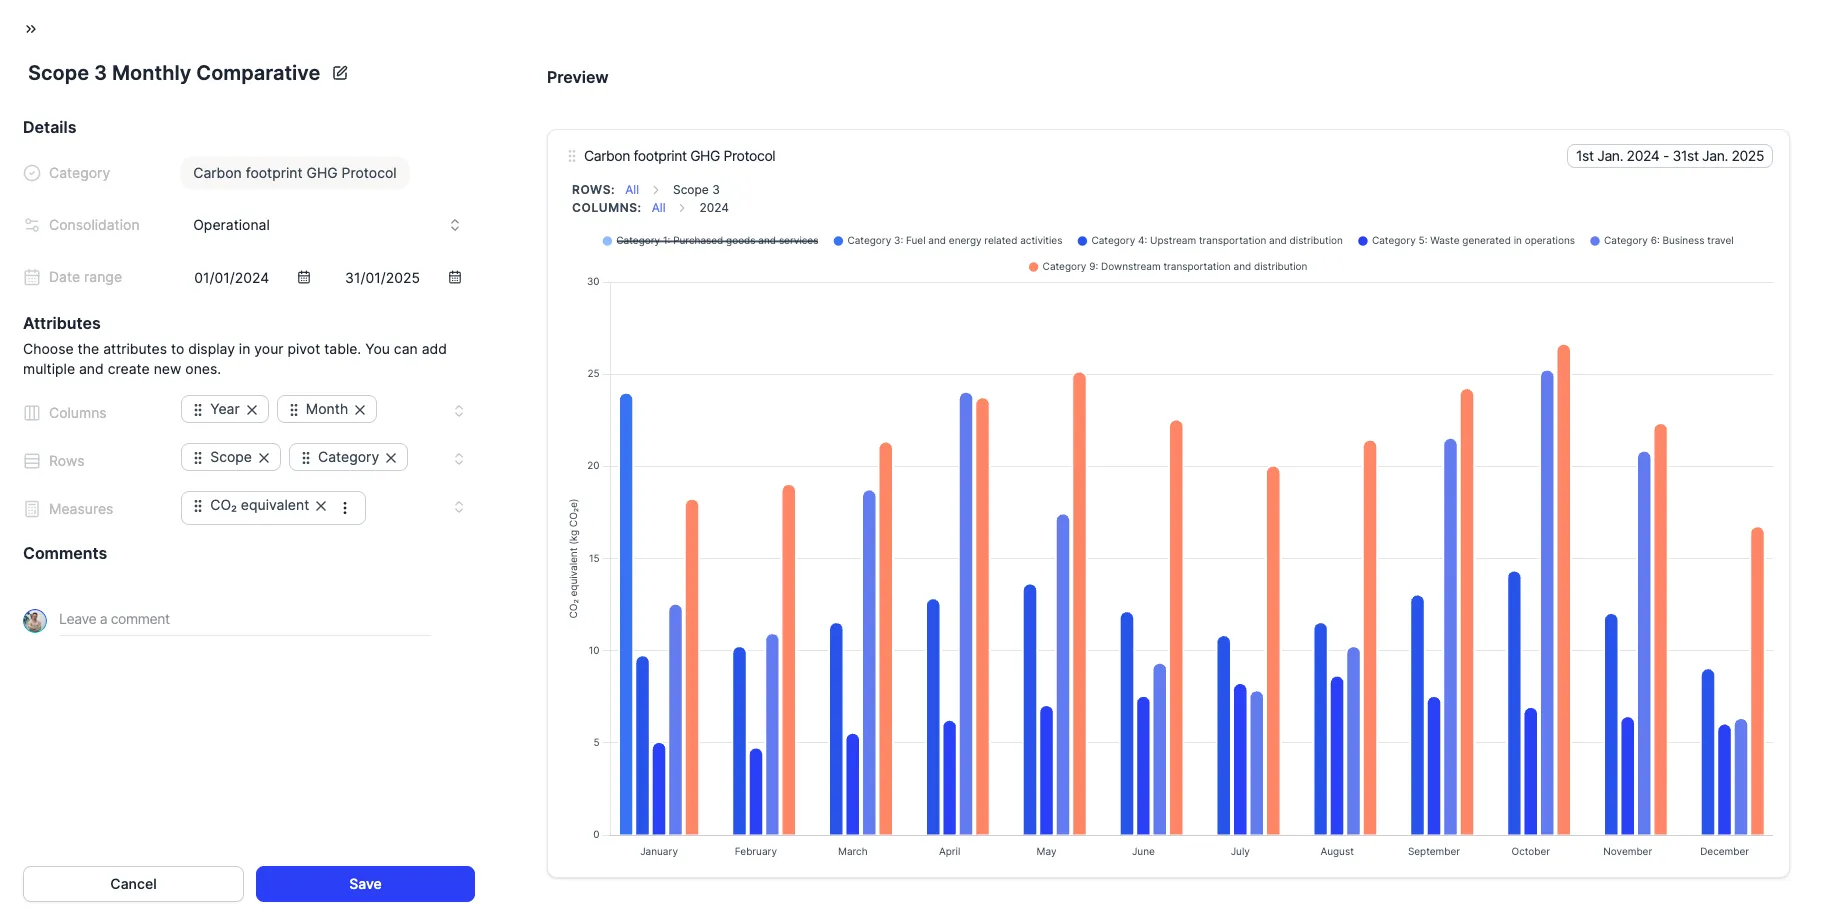
- Bar chart showing impact by product phase
- Top contributors to impact in the production stages
- Cross-filtering: click on any stage or phase to filter data across all charts Access the dashboard from the detail view of any LCA in your portfolio. You can switch between the dashboard and the calculation canvas at any time.