

Tired of wrestling with spreadsheets every time someone asks for an accident or absenteeism report? We hear you 😅.
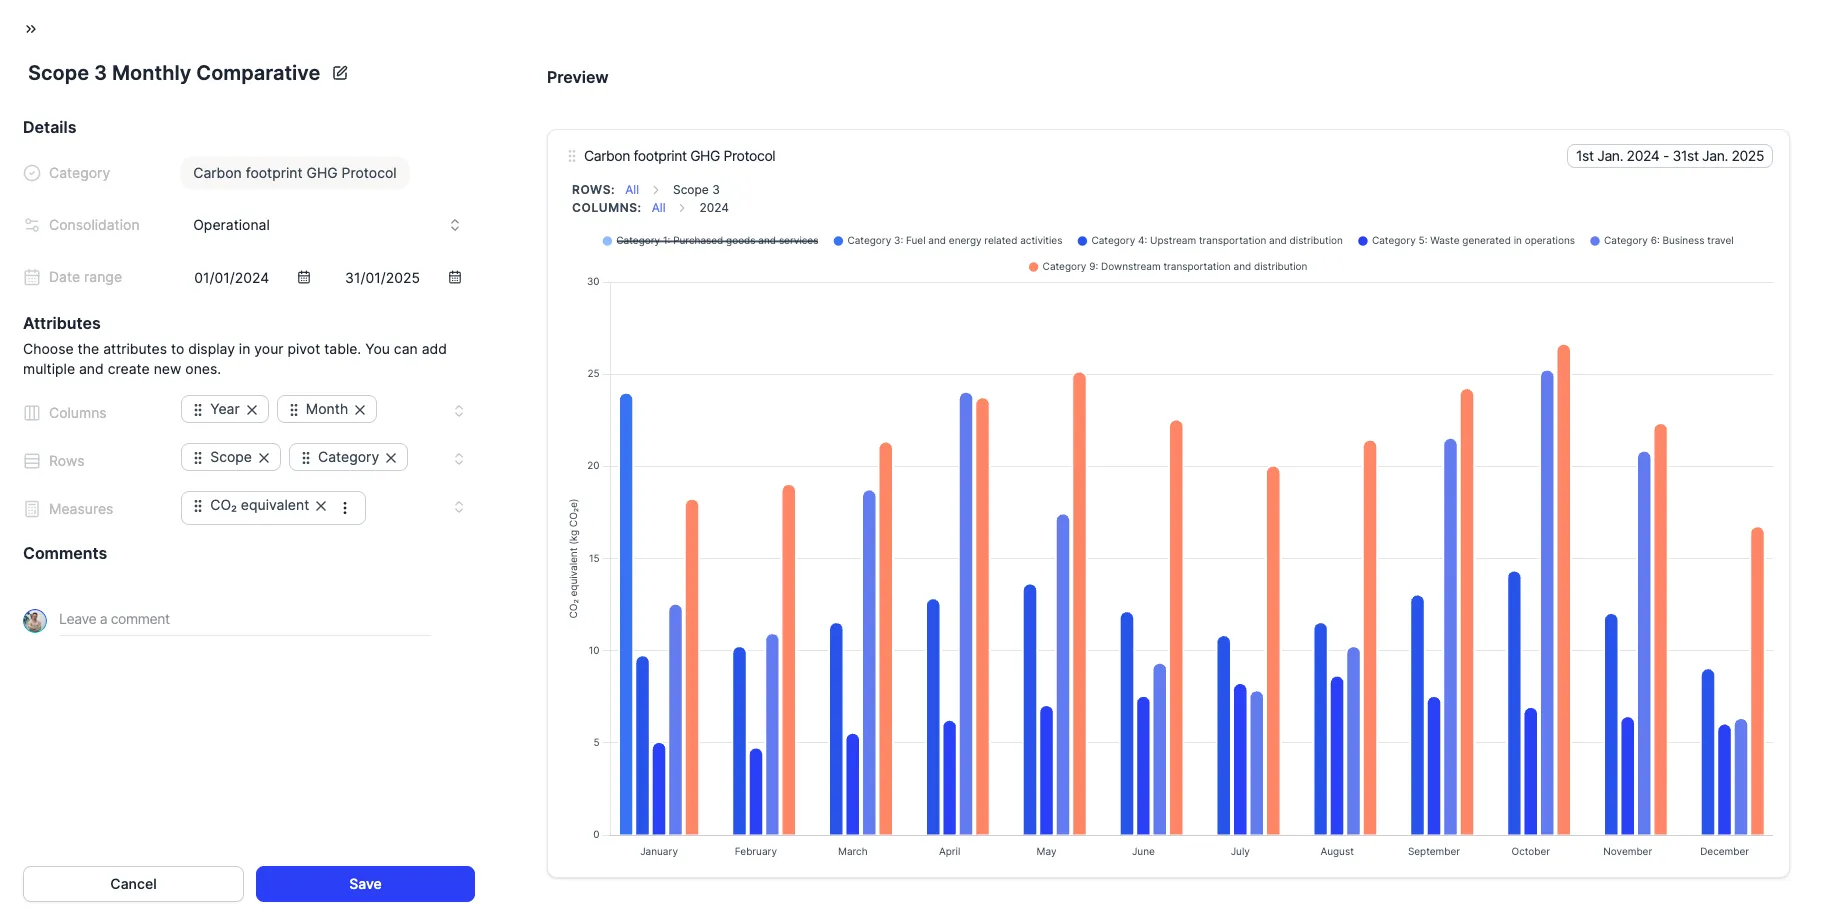
We’ve shipped a fully configurable pivot table that puts you in control: pick your rows, columns, and metrics, by site, period, incident type, severity, whatever your report needs.
The game-changer? When you hit download, the Excel is a perfect mirror of what’s on your screen. That means you can plug the table straight into your GRI sustainability report: no reformatting, no manual data entry, no room for errors. Platform to report in a couple of clicks.
🔀 Your data, your way, pivot across any dimension and metric 📥 True WYSIWYG export, the Excel matches your view exactly 📑 GRI-report ready, drop the table directly into your sustainability report 🤝 Audit-ready in seconds: share straight with auditors, H&S, or leadership ⚡ Real-time connection, always reflects your latest records
Built for: ISO 45001 · CSRD · Sustainability Reporting · Internal Reporting
It’s live in your account right now. Give it a spin and let us know how you get on, your feedback helps us keep making it better 🙂
Do not have access yet? Request a demo and we will show you how it works! ☝️