
Dcycle en directoDeja de perseguir datosJueves 29 de octubre · 11:00hReserva tu plaza

Huella de carbono

Impact Dashboard for Life Cycle Assessments

Luis avatar Luis · · 1 min de lectura
Impact Dashboard for Life Cycle Assessments

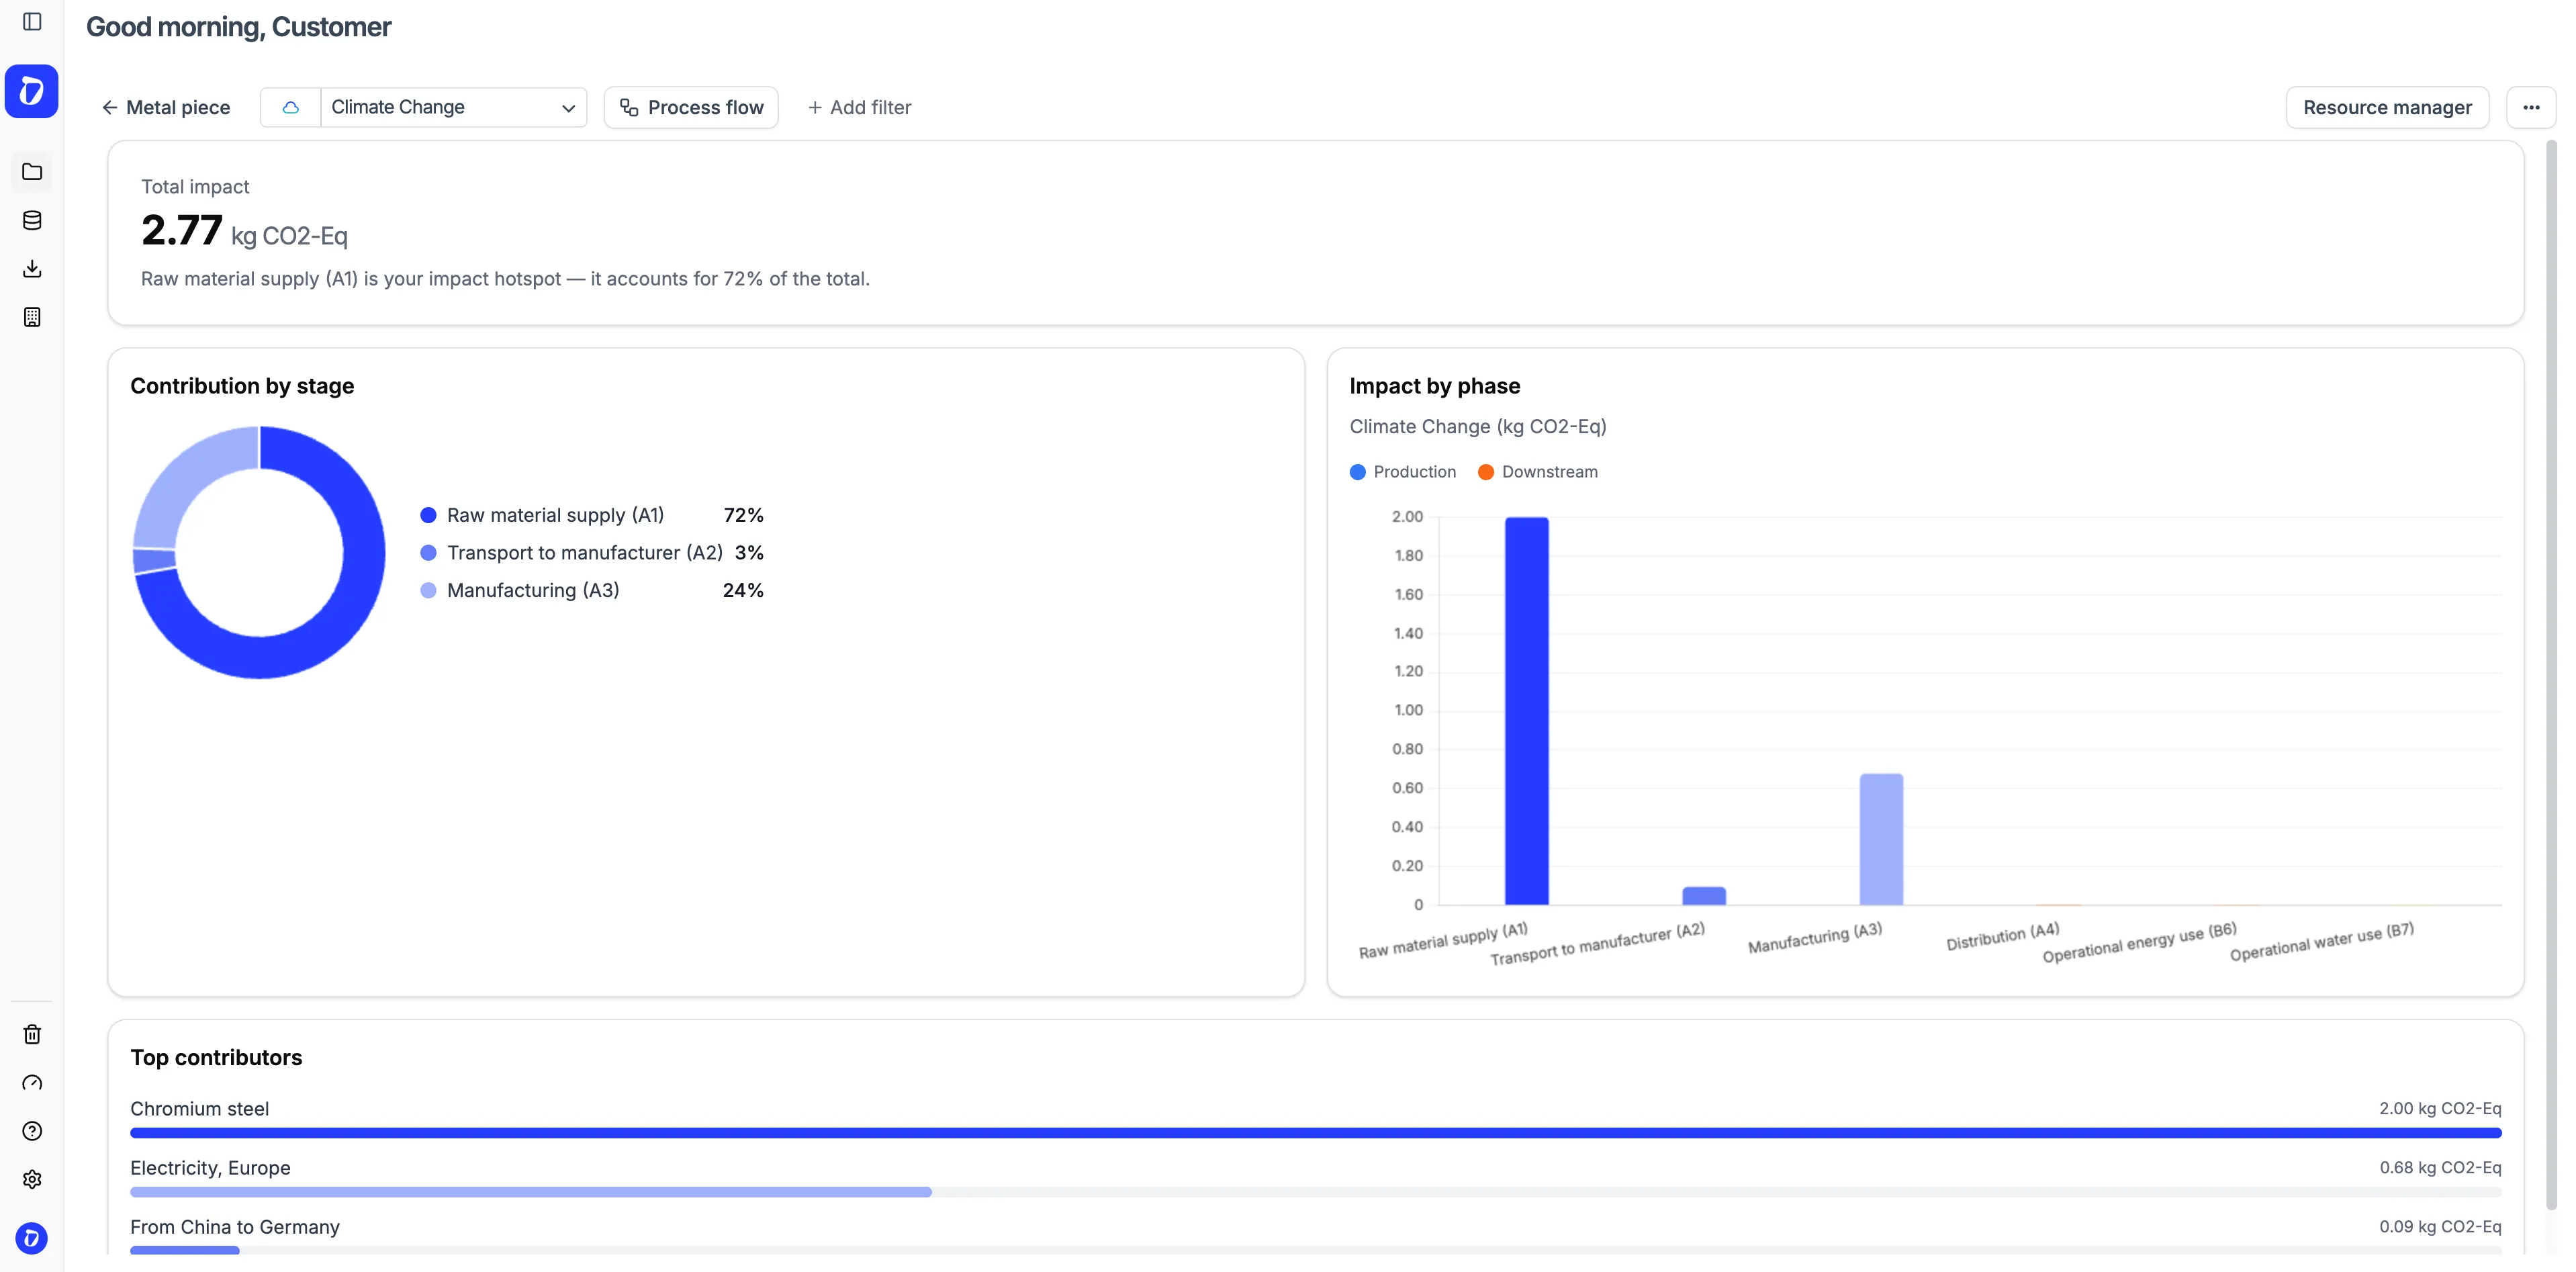
Introducing the Life Cycle Assessment (LCA) Dashboard.

You can now analyze the environmental impact of your products in a visual, intuitive way: broken down by life-cycle stages according to the EN 15804 standard: raw materials (A1), transport (A2), manufacturing (A3), distribution (A4), operational energy use (B6), and operational water use (B7).

The dashboard includes:

  • Total impact with the corresponding unit of measurement
  • Donut chart showing the breakdown by life-cycle stage
  • Bar chart showing impact by product phase
  • Top contributors to impact in the production stages
  • Cross-filtering: click on any stage or phase to filter data across all charts Access the dashboard from the detail view of any LCA in your portfolio. You can switch between the dashboard and the calculation canvas at any time.
Product UpdateHuella de carbono
Demo de 30 minutos

Pruébalo con tus propios datos.

Reserva 30 minutos con nuestro equipo para ver cómo se integran tus datos y qué valor te devuelven.

Solicitar demo
  • Sin compromiso
  • Con tus datos
  • En tu idioma

Así será tu sesión

  1. 01 Nos cuentas qué tienes que reportarMarcos, plazos y quién lo pide. 0–5 min
  2. 02 Vemos cómo entrarían tus datosFacturas, ERP, proveedores: con un ejemplo parecido al tuyo. 5–20 min
  3. 03 Te llevas el planQué automatizar primero y cuánto tiempo ahorras. 20–30 min
Con alguien del equipo que luego te acompaña