

Dcycle en directoDeja de perseguir datosJueves 29 de octubre · 11:00hReserva tu plaza

Datos

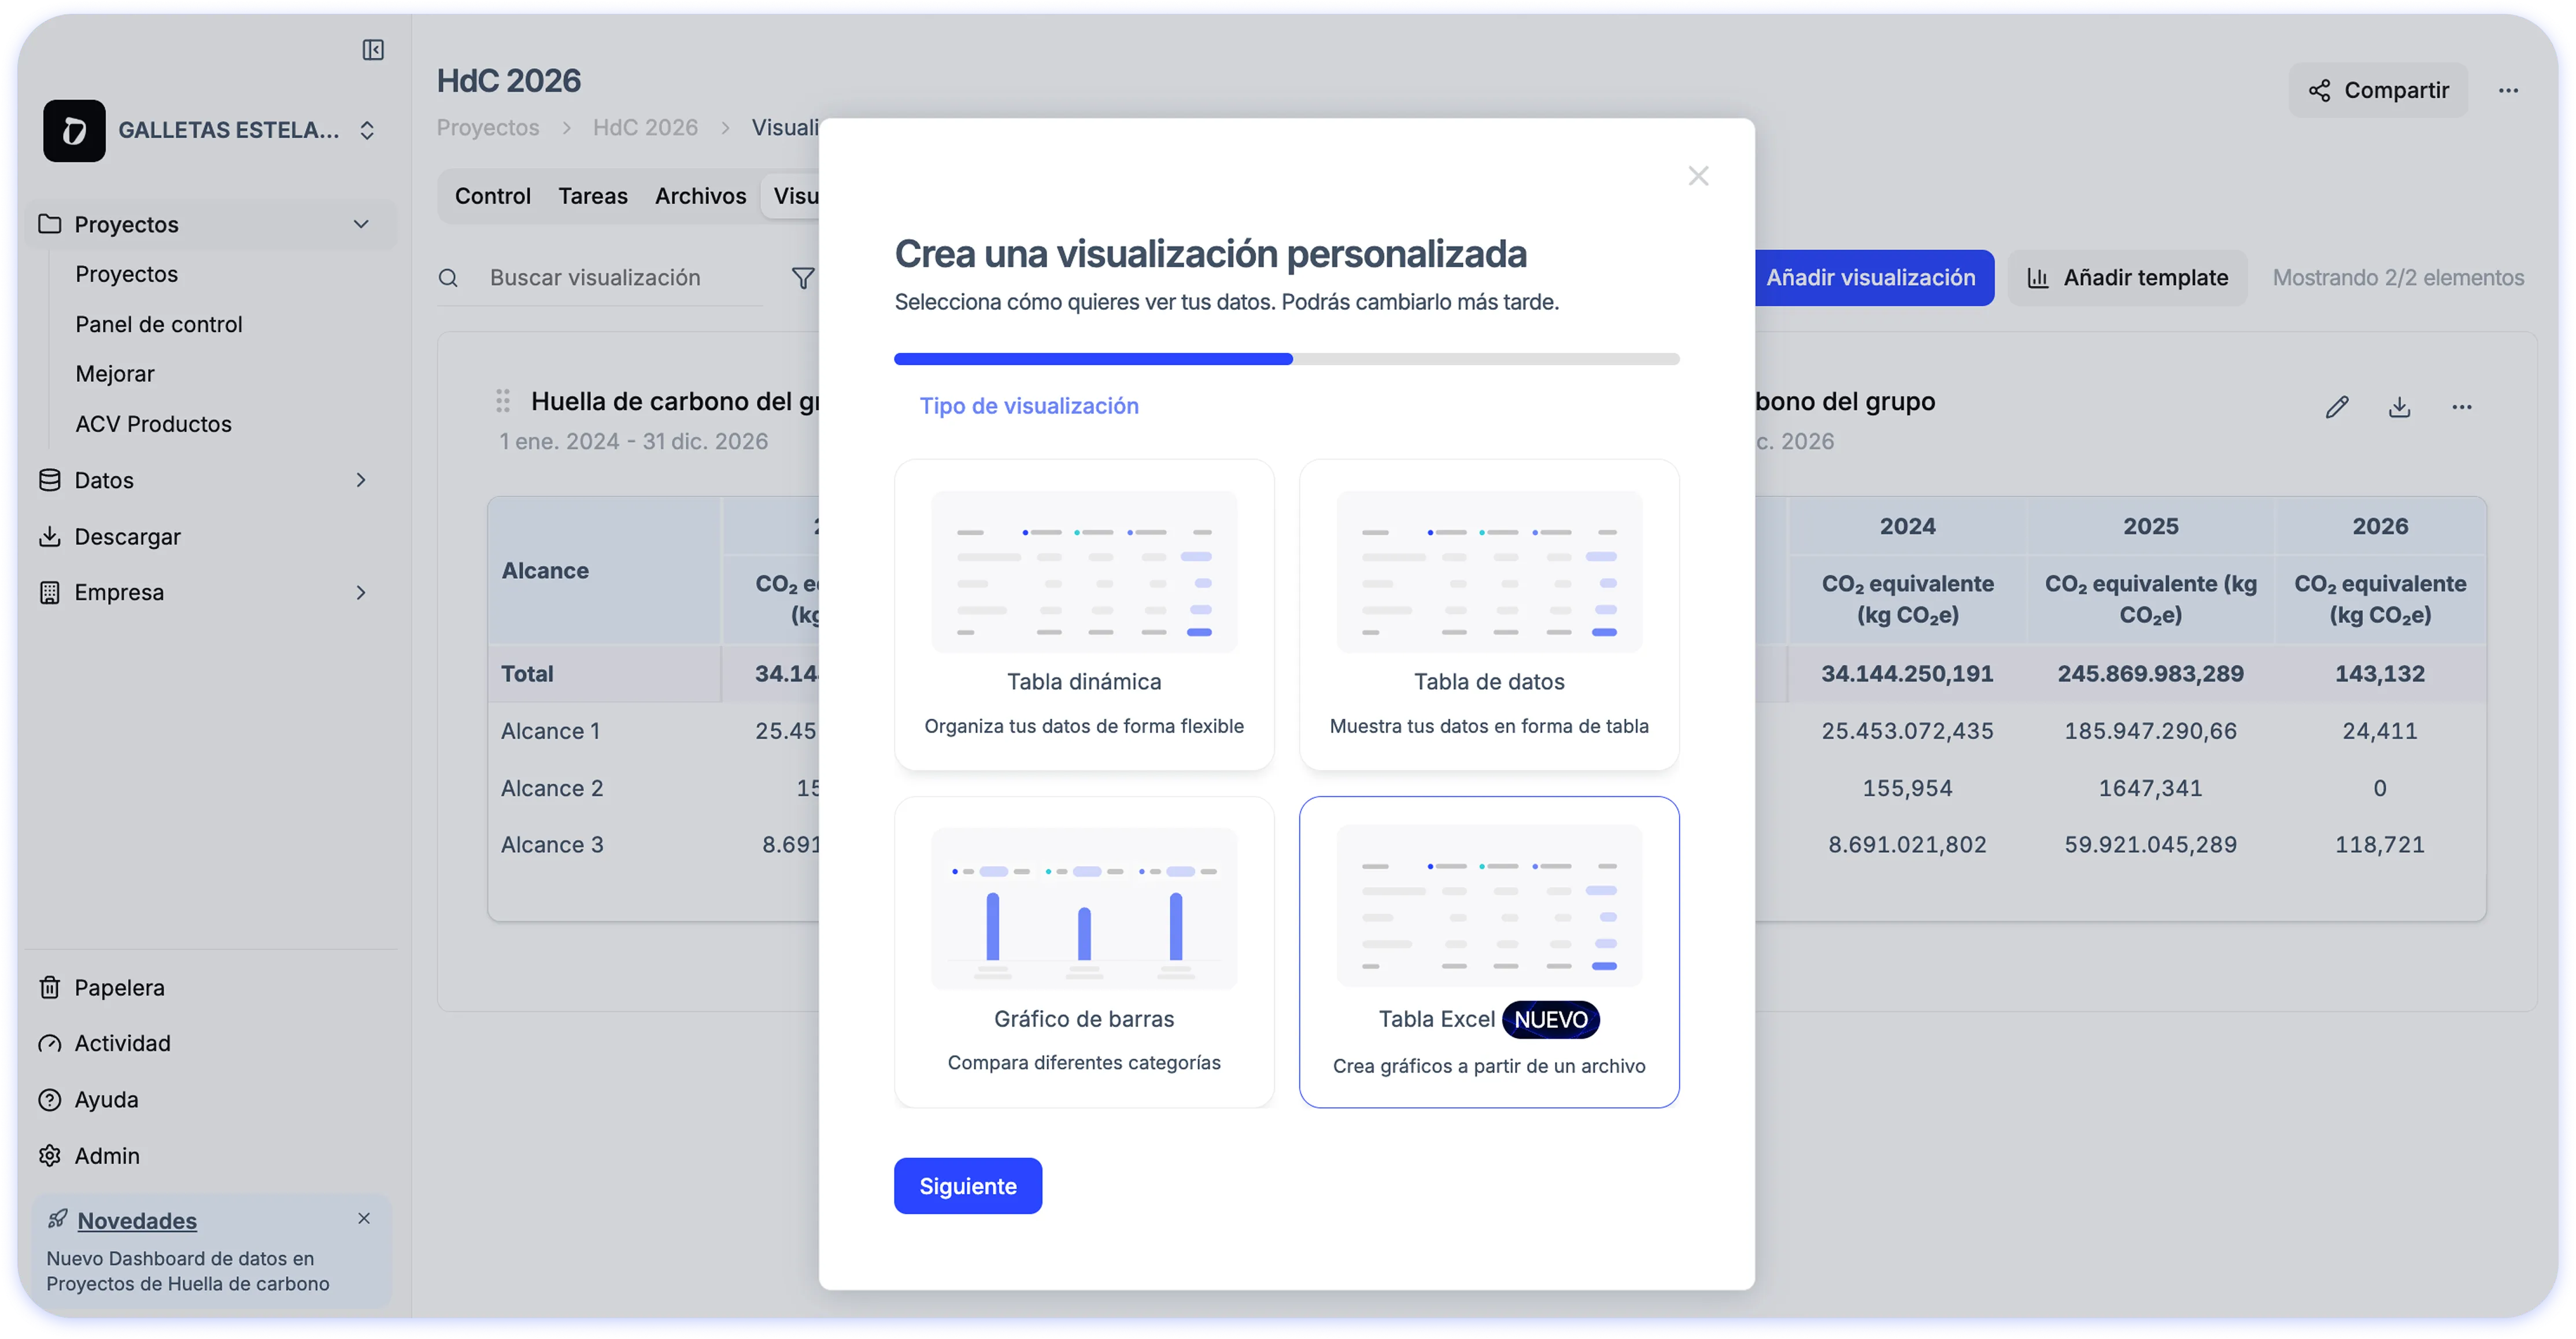
Visualizations directly from your Excel

Vanesa García avatar Vanesa García · · 1 min de lectura
Visualizations directly from your Excel

If you usually spend a lot of time building tables and charts for sustainability reports, carbon footprint calculations, or internal analysis, this update will make your workflow much easier.

📊 Automatic visualizations from Excel

When you upload your Excel file, Dcycle generates ready-to-use visualizations so you can:

  • See your data automatically updated after processing
  • Avoid complex manual configurations
  • Analyze results with flexibility and detail before reporting

✨ How does it work?

Simply upload your Excel file from the Visualizations section and Dcycle will automatically create the charts. You can then adjust, customize, or create new visualizations based on your needs.

Product UpdateDatos
Demo de 30 minutos

Pruébalo con tus propios datos.

Reserva 30 minutos con nuestro equipo para ver cómo se integran tus datos y qué valor te devuelven.

Solicitar demo
  • Sin compromiso
  • Con tus datos
  • En tu idioma

Así será tu sesión

  1. 01 Nos cuentas qué te pidenClientes, auditores o bancos: qué datos y para cuándo. 0–5 min
  2. 02 Vemos cómo entrarían tus datosFacturas, ERP, proveedores: con un ejemplo parecido al tuyo. 5–20 min
  3. 03 Te llevas el planQué automatizar primero y cuánto tiempo ahorras. 20–30 min
Con alguien del equipo que luego te acompaña