

February 01 / 05
Year-end close and the taxonomy
Who asksYour statutory auditor
With Dcycle
Eligible CAPEX, OPEX and turnover come from the same source as the accounts, and you start from last year’s reconciliation.
The bank questionnaire, the taxonomy with the accounts, the budget. Dcycle turns that spreadsheet into data with its invoice behind it, ready for each of them.
The same information, in a spreadsheet and in Dcycle
Teams at these companies already rely on Dcycle






“I don’t know what sustainability data costs us today”
With Dcycle. In the demo we put what you already pay, consultant, verifier and your team’s hours, next to running it on a platform, with your own figures.
You haven’t compared today’s data yet
“The bank or the fund must not catch us without data”
With Dcycle. The data is live and every figure links to its invoice or reading. You answer the bank’s questionnaire on the spot, from the same source as the accounts.
34 questions unanswered
“The taxonomy lands on me, and it comes out of accounting”
With Dcycle. The environmental figure and the accounting figure come from the same source. The reconciliation is saved with its evidence, and next year you start from there.
2026 taxonomy not calculated
Who asksYour statutory auditor
Eligible CAPEX, OPEX and turnover come from the same source as the accounts, and you start from last year’s reconciliation.
Who asksThe board and the verifier
Every figure links to its invoice or reading, ready to verify.
Who asksYour bank, fund or insurer
You answer with live data, not a figure from eight months ago.
Who asksWhoever finances you
Several years of history and their evidence, ready to download when asked.
Who asksManagement
You compare what you pay today for the data with running it on a platform, with your figures.
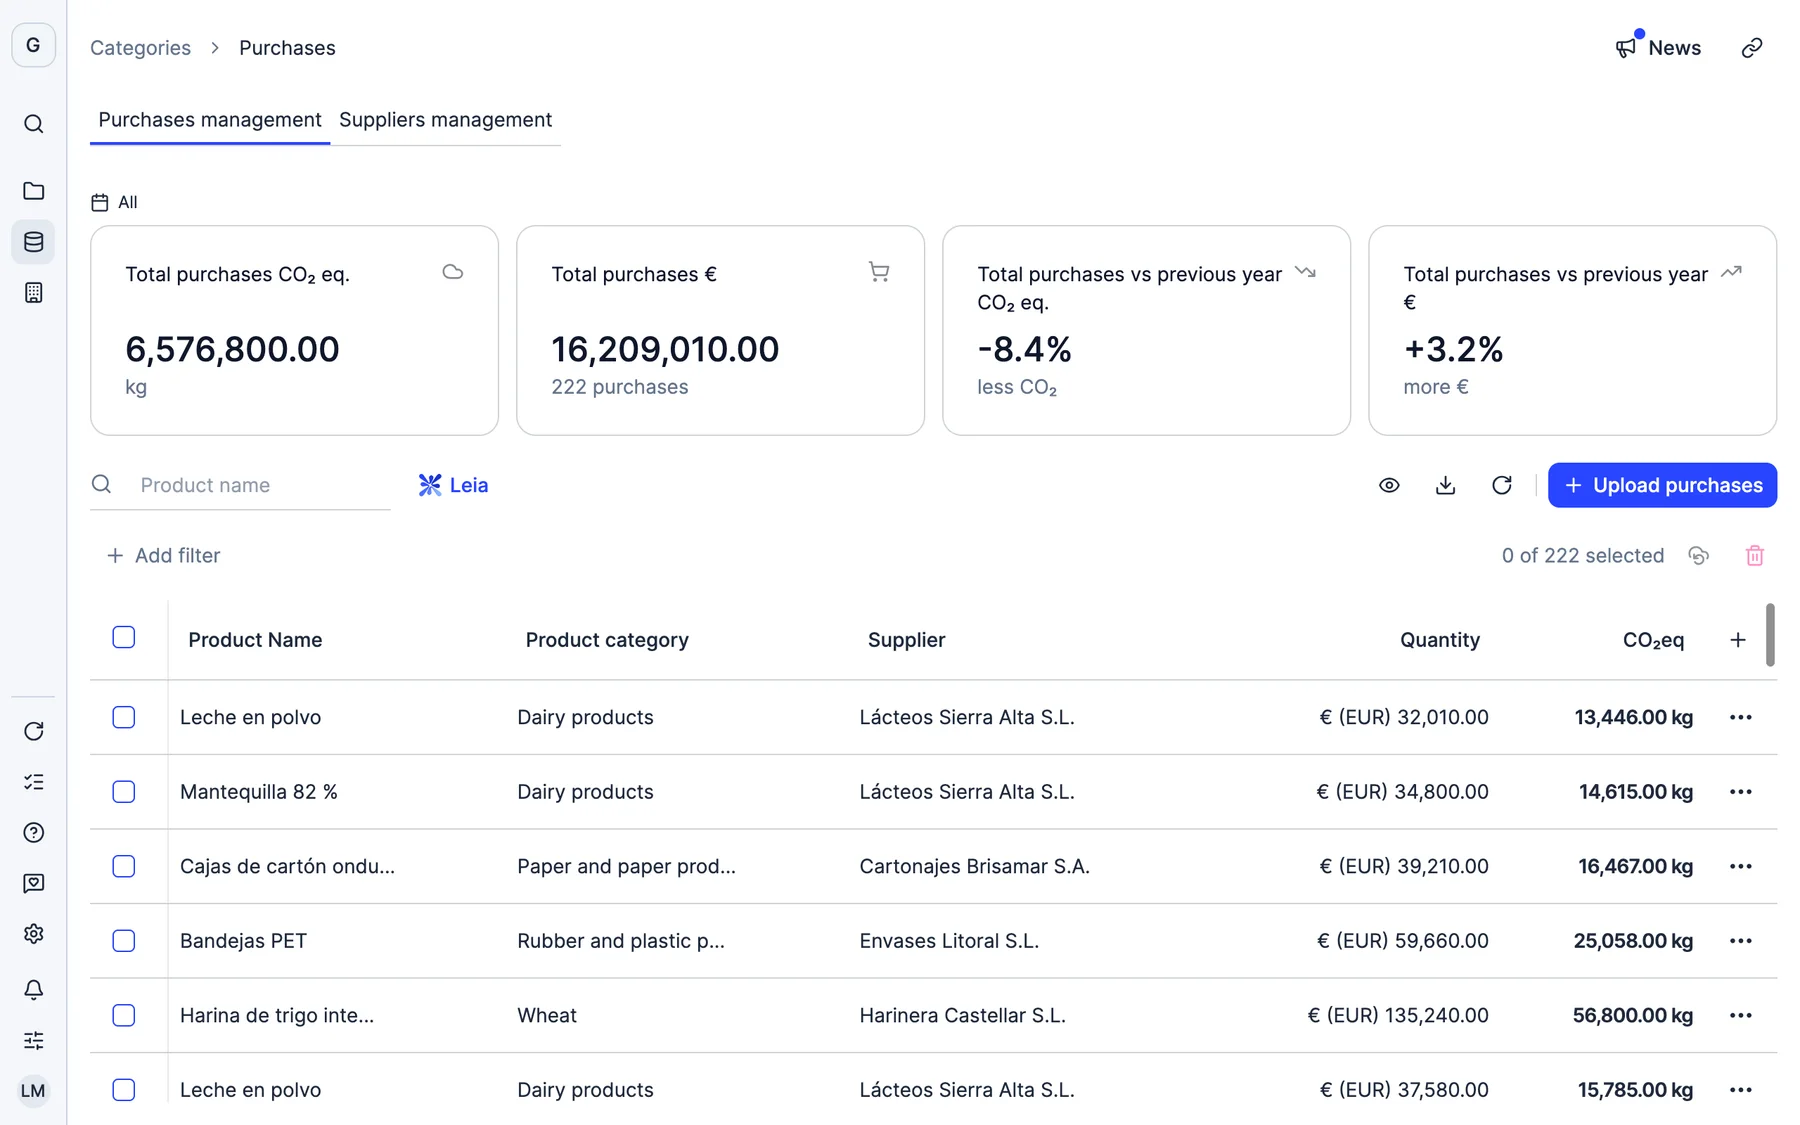
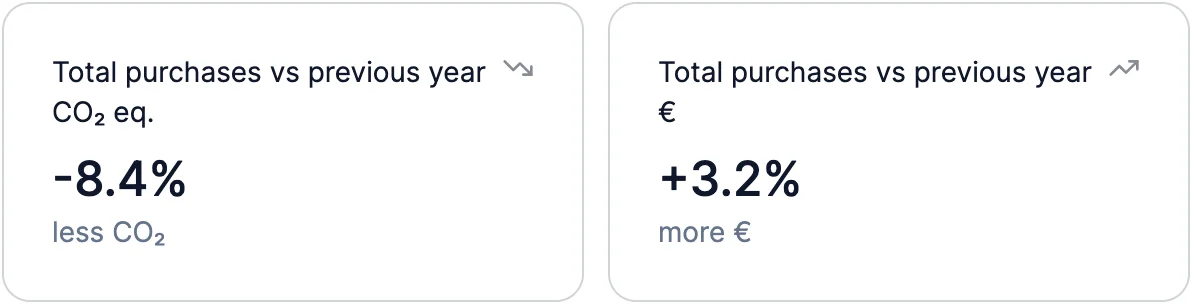
Purchase spend against its footprint, year on year: when the amount goes up and the CO₂ comes down, the supplier strategy is working.
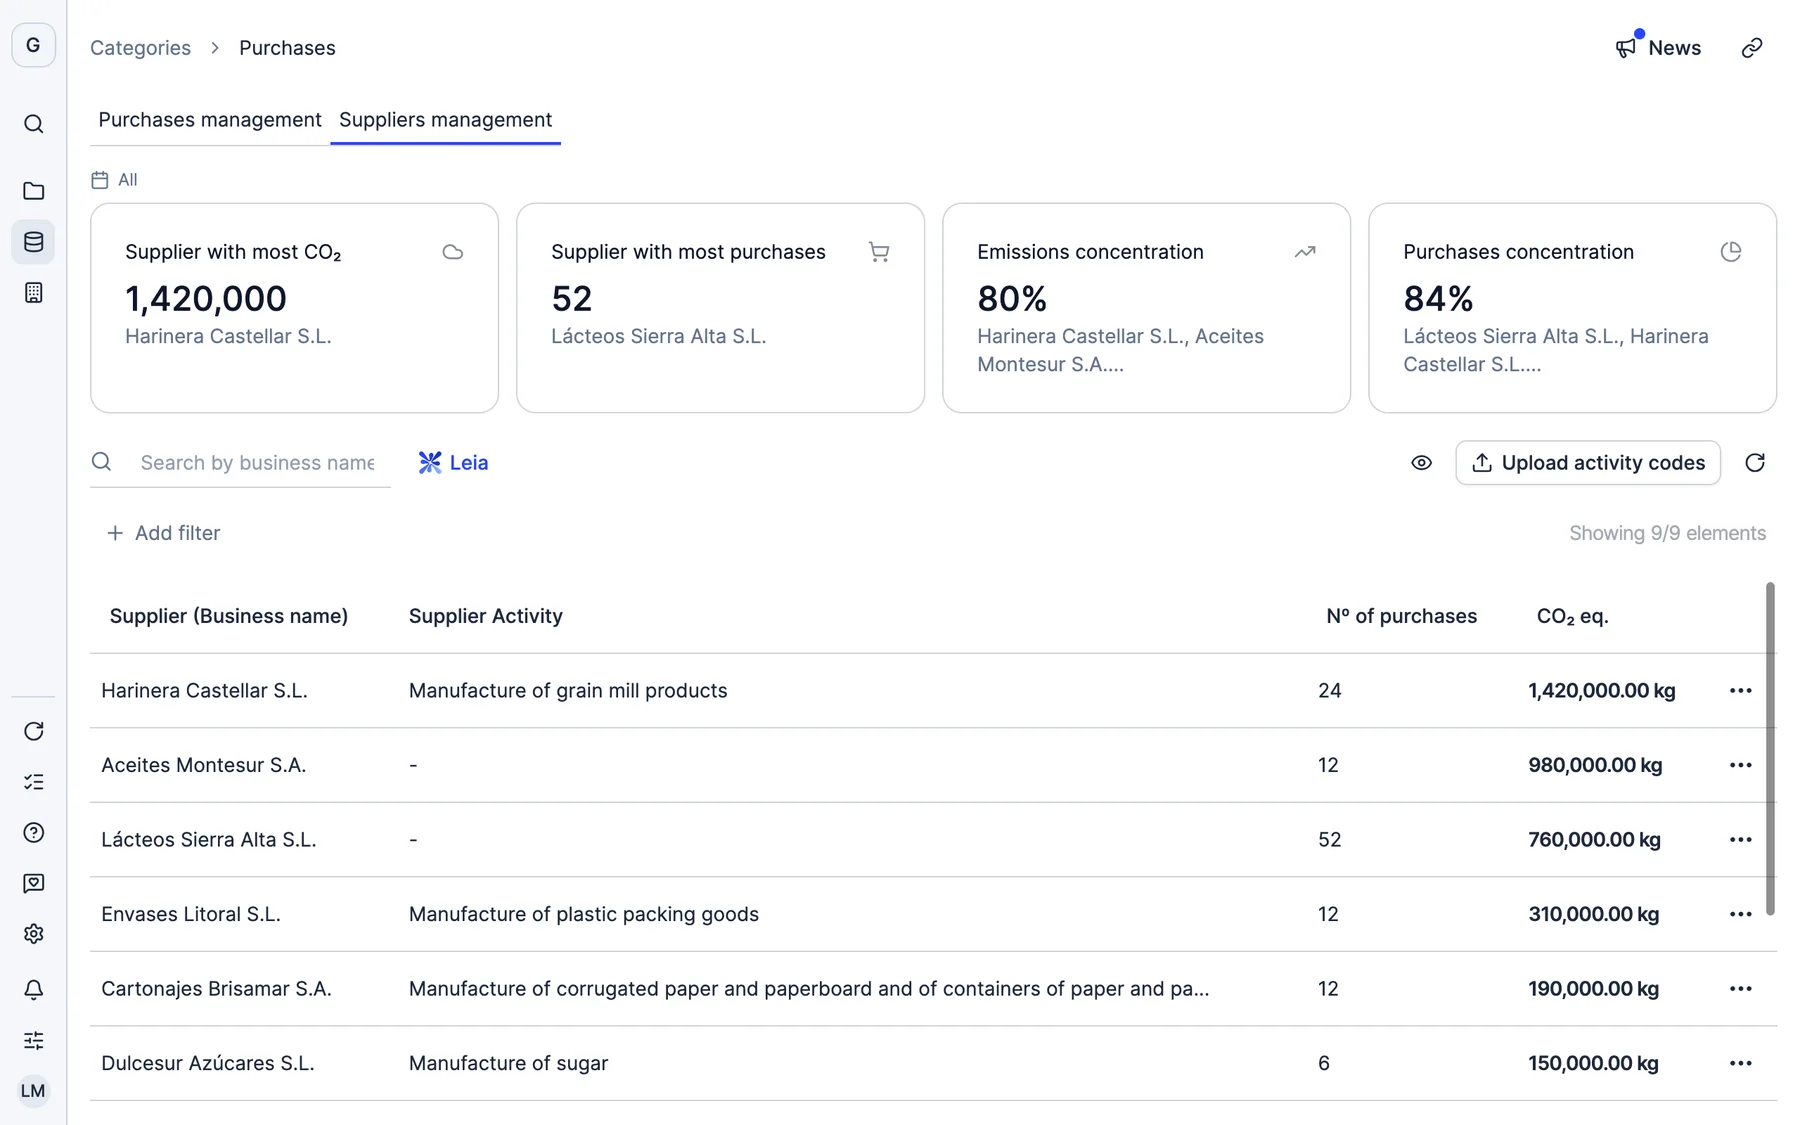
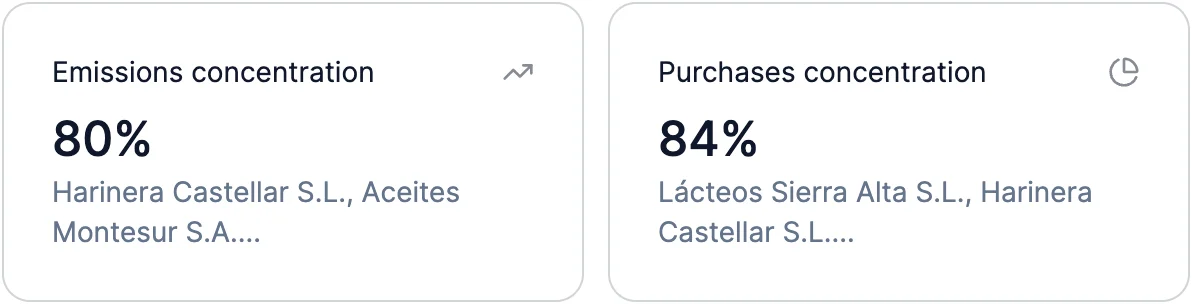
A handful of suppliers hold 84% of your purchases and 80% of their emissions: that is where the dependency is and where the negotiation starts.
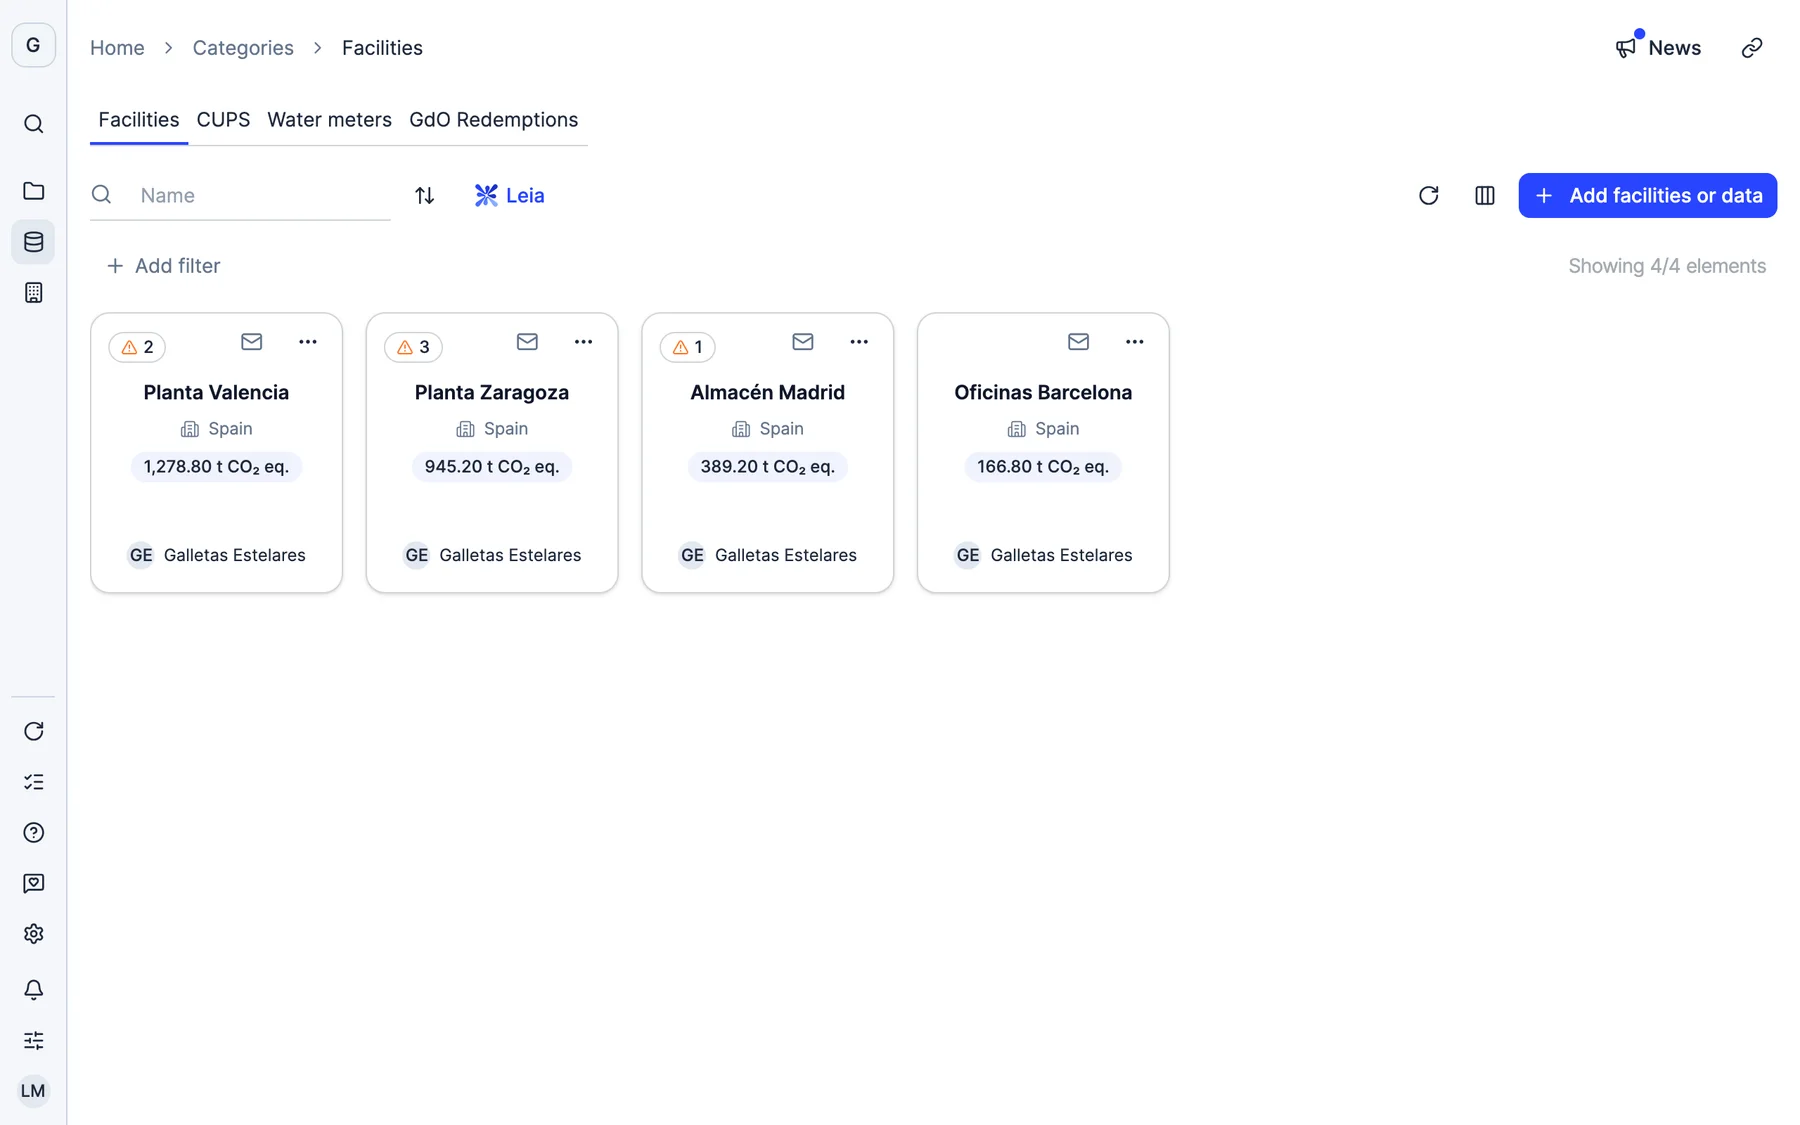
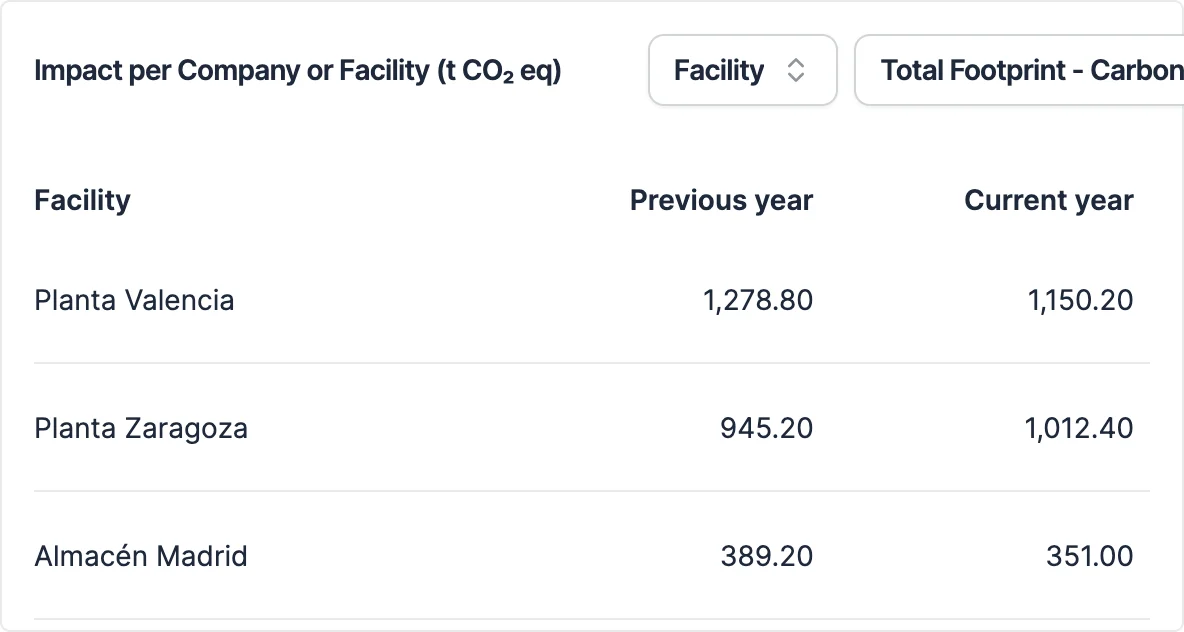
Every site against last year: Valencia comes down and Zaragoza goes up, so you know where to invest first.
Every category against last year: purchased electricity down 30%, downstream transport up. What already works and what needs investment.
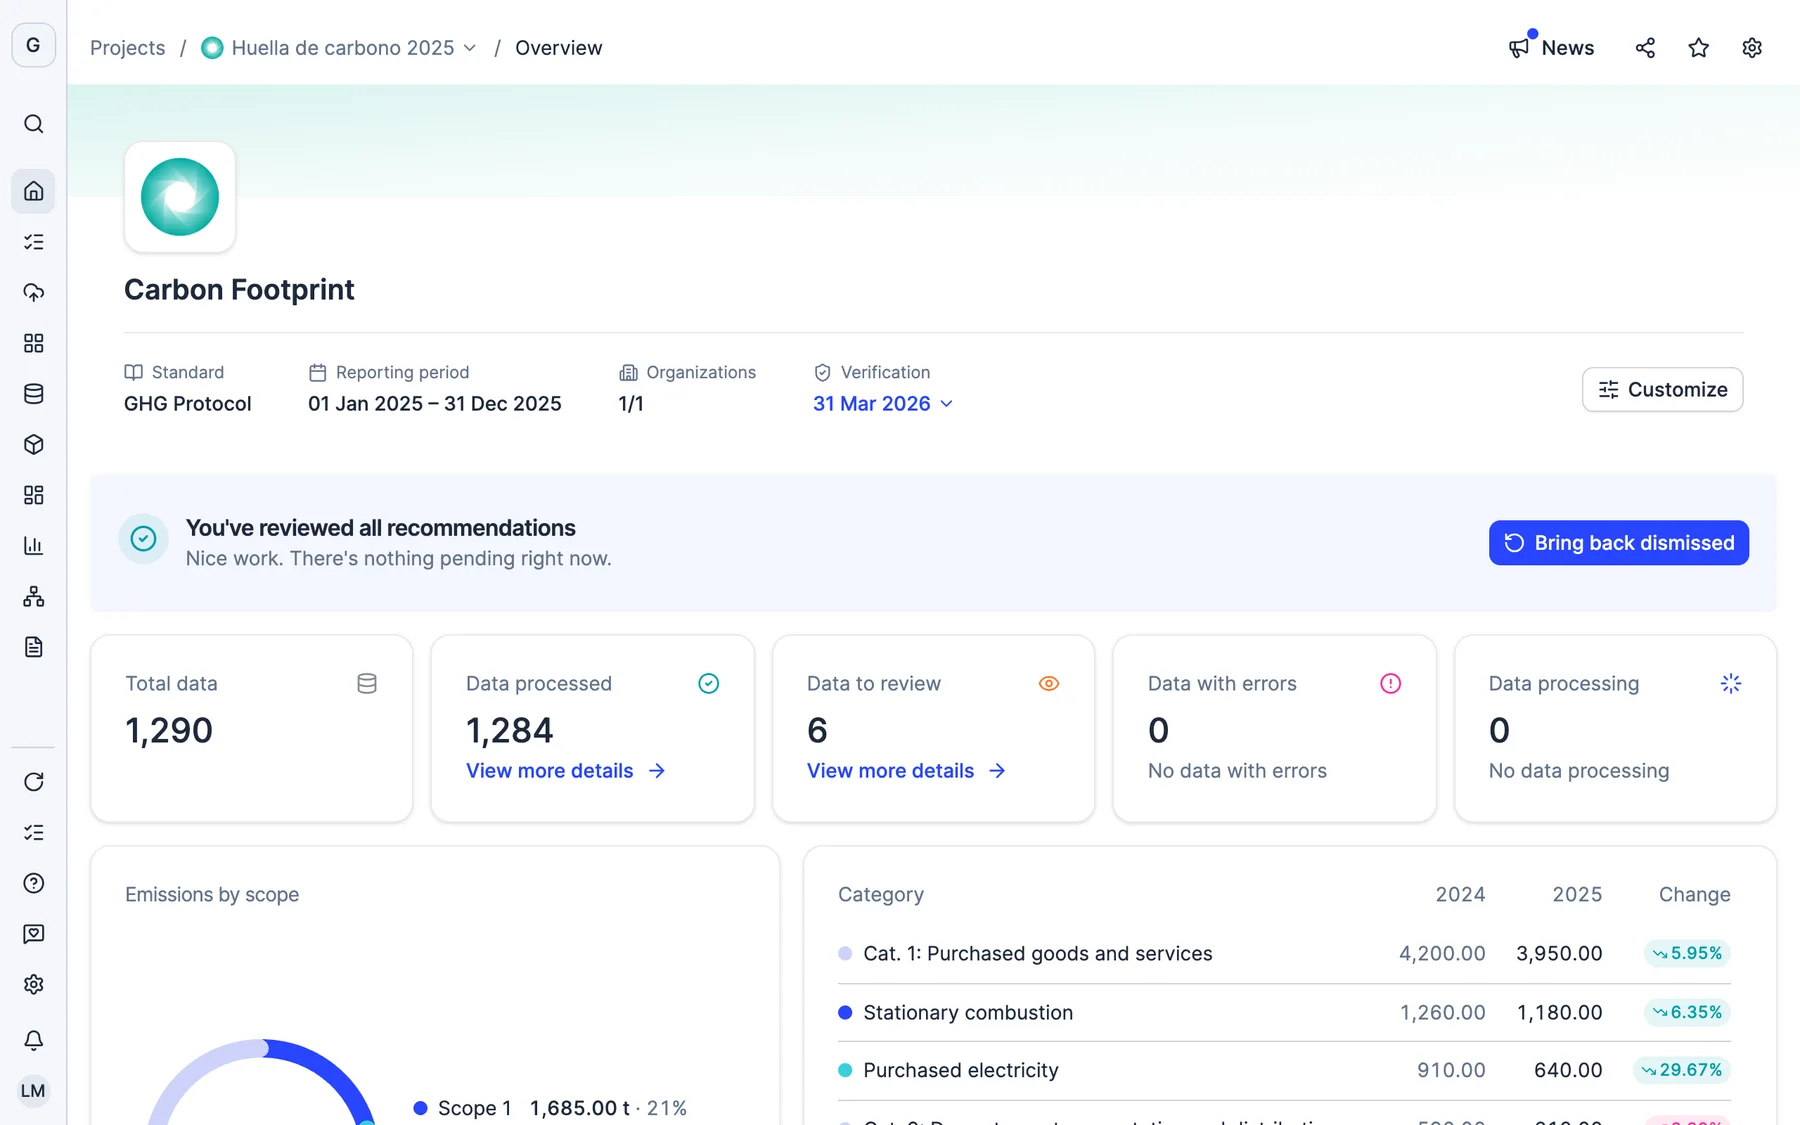
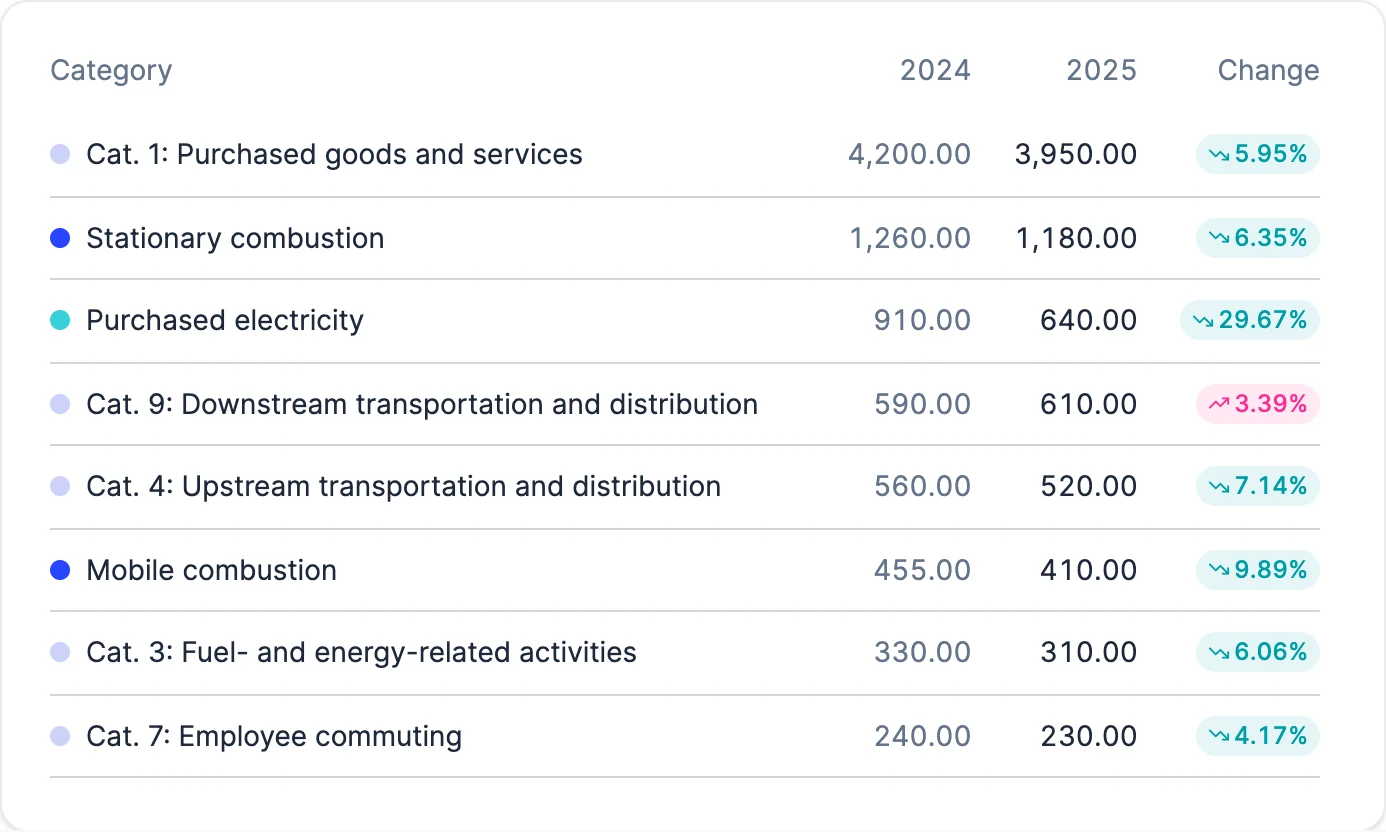
Real screens of Dcycle with the data of a made-up company.
The data you load for your own work completes other teams’ data. Together they answer questions none of them could alone.
Knows what it costs.
Knows how it runs.
Knows the impact.
Plant C spends €186,000 a year too much on energy.
Ajinomoto AgroSolutions structures its emissions measurement across the entire agricultural value chain
Read the caseYes. Integrations connect ERPs such as SAP, Sage and Dynamics, and invoices and spreadsheets can be uploaded, so the footprint is calculated from the purchases you already record.
Yes. EU Taxonomy alignment is one of the frameworks Dcycle reports under, from the same data that feeds CSRD, so the figures finance publishes and the sustainability report match.
Only the people you give access to. Permissions are set per team and per data set, and every figure keeps a link to the document it came from.
Compare it with what you already pay: consultants, hours spent rebuilding the same data for each report and duplicated tools. In a demo we work it out with your own figures.
We are ISO 27001 certified, GDPR compliant and data is hosted in the EU. Roles and permissions decide who sees and edits each data set, and the security documentation is public.
security.dcycle.io →The platform automates collection and calculation, and our advisors help you get started and with every report, so nothing is left behind.
Expert guidance →And if your question isn’t here, we answer it in the demo.
How the 30 minutes go
ISO 27001 · GDPR · Hosted in the EU · No commitment
Pick a day and time