

January 01 / 05
The year’s readings and invoices
Who asksSustainability
With Dcycle
Invoices are read automatically and each person delivers only their own data. Nobody at the plant fills in a spreadsheet.
Consumption, output and cost in one view, from the data already in your ERP, meters and invoices.
The same information, in a spreadsheet and in Dcycle
Teams at these companies already rely on Dcycle






“I have inefficiency data everywhere, and none of it is connected”
With Dcycle. Dcycle puts consumption, output and cost per plant in one view: which site is slipping, what each tonne costs and where the gap is.
No plant data for October
“We are measuring the same thing twice”
With Dcycle. Dcycle reads your ERP, meters and invoices. One set of indicators serves the plant and the report.
Three sources not connected
“This must not become more paperwork for my people”
With Dcycle. Each person gets only their own data point, with a due date and an owner. They drop the invoice as it is and Dcycle reads it: no new template, no training.
October close not started
Who asksSustainability
Invoices are read automatically and each person delivers only their own data. Nobody at the plant fills in a spreadsheet.
Who asksThe verifier
Every plant figure links to its invoice or meter reading.
Who asksManagement
Intensity by plant: which site is slipping and what the gap costs.
Who asksFinance
Each efficiency measure with its cost and what it reduces, in the same plan.
Who asksSales and your clients
Plant data is already in Dcycle, so nobody asks you for it again.
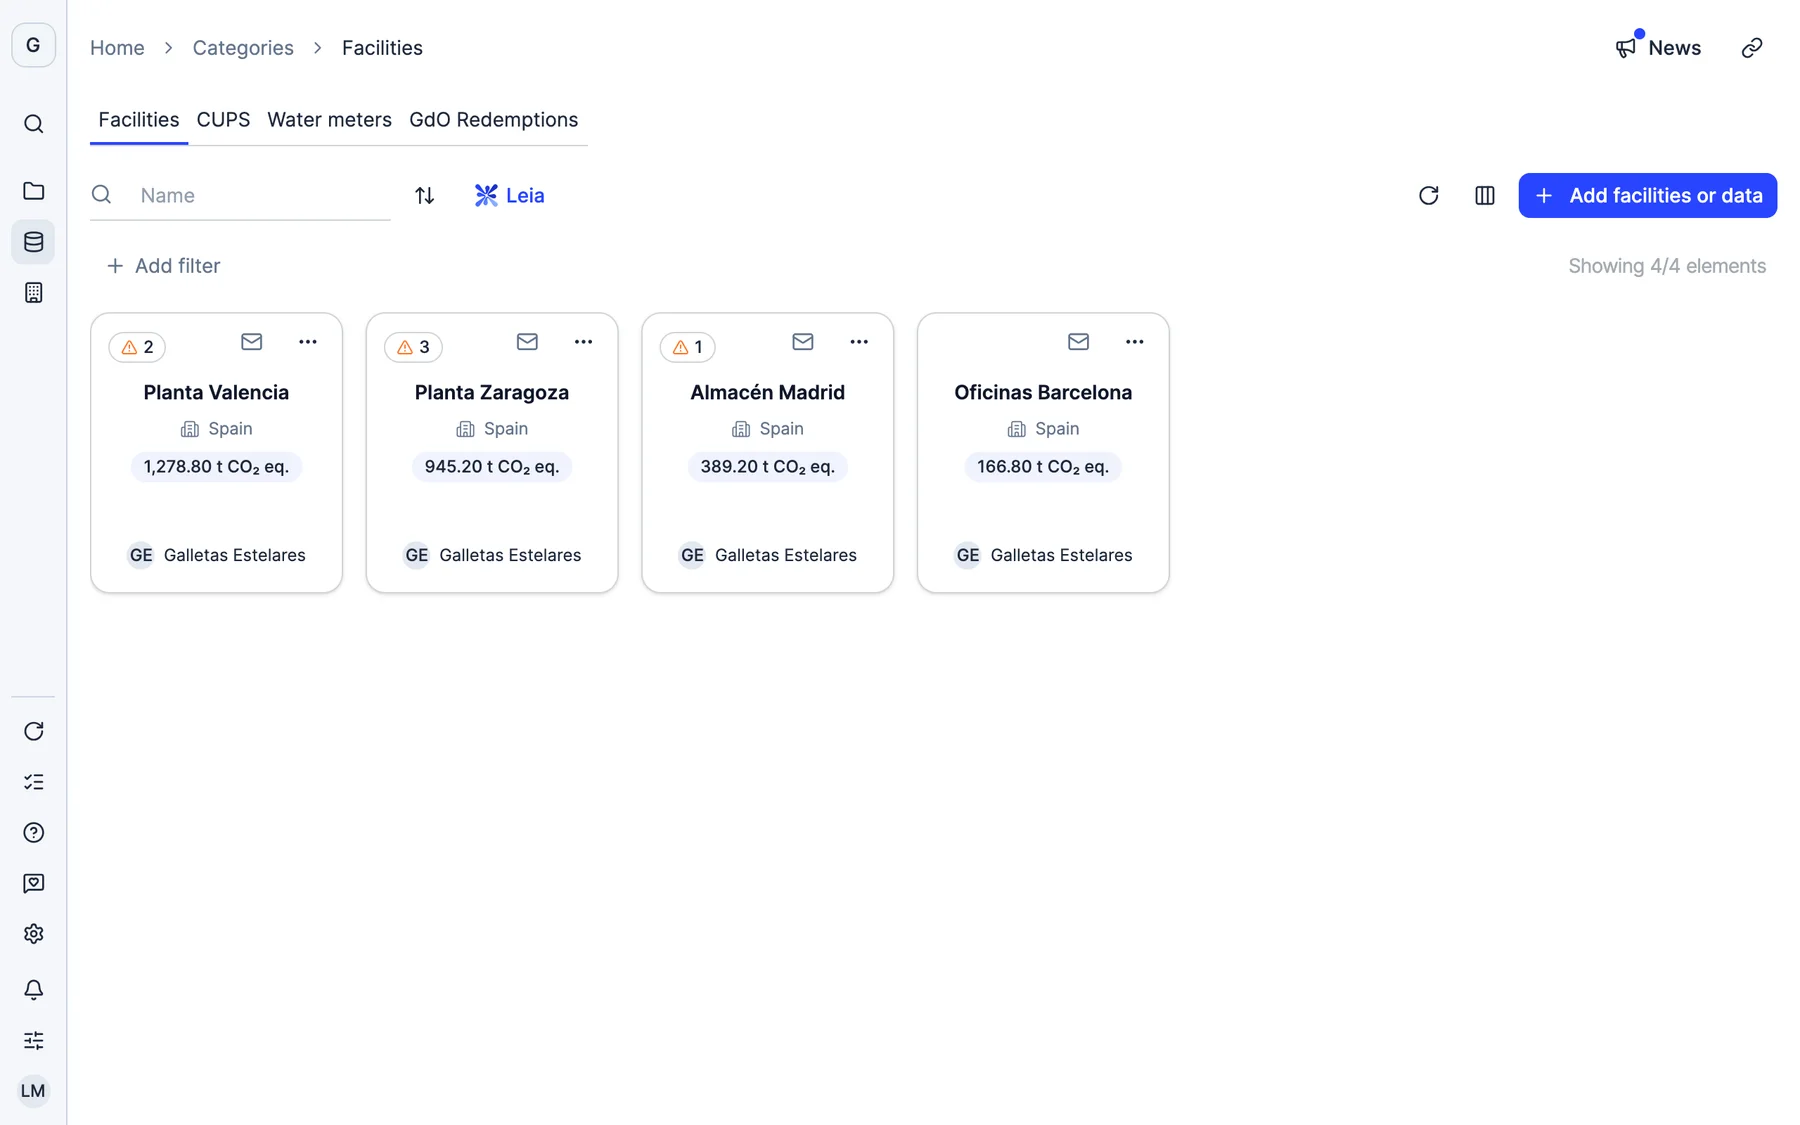
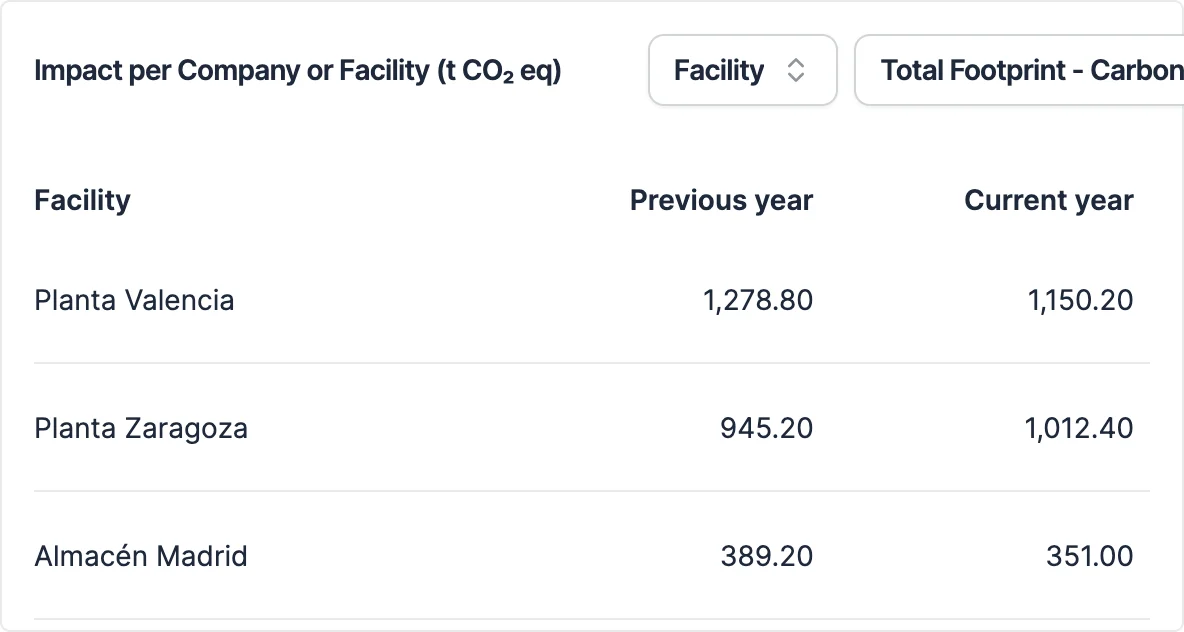
Every site against last year: Valencia comes down and Zaragoza goes up, so you know where to invest first.
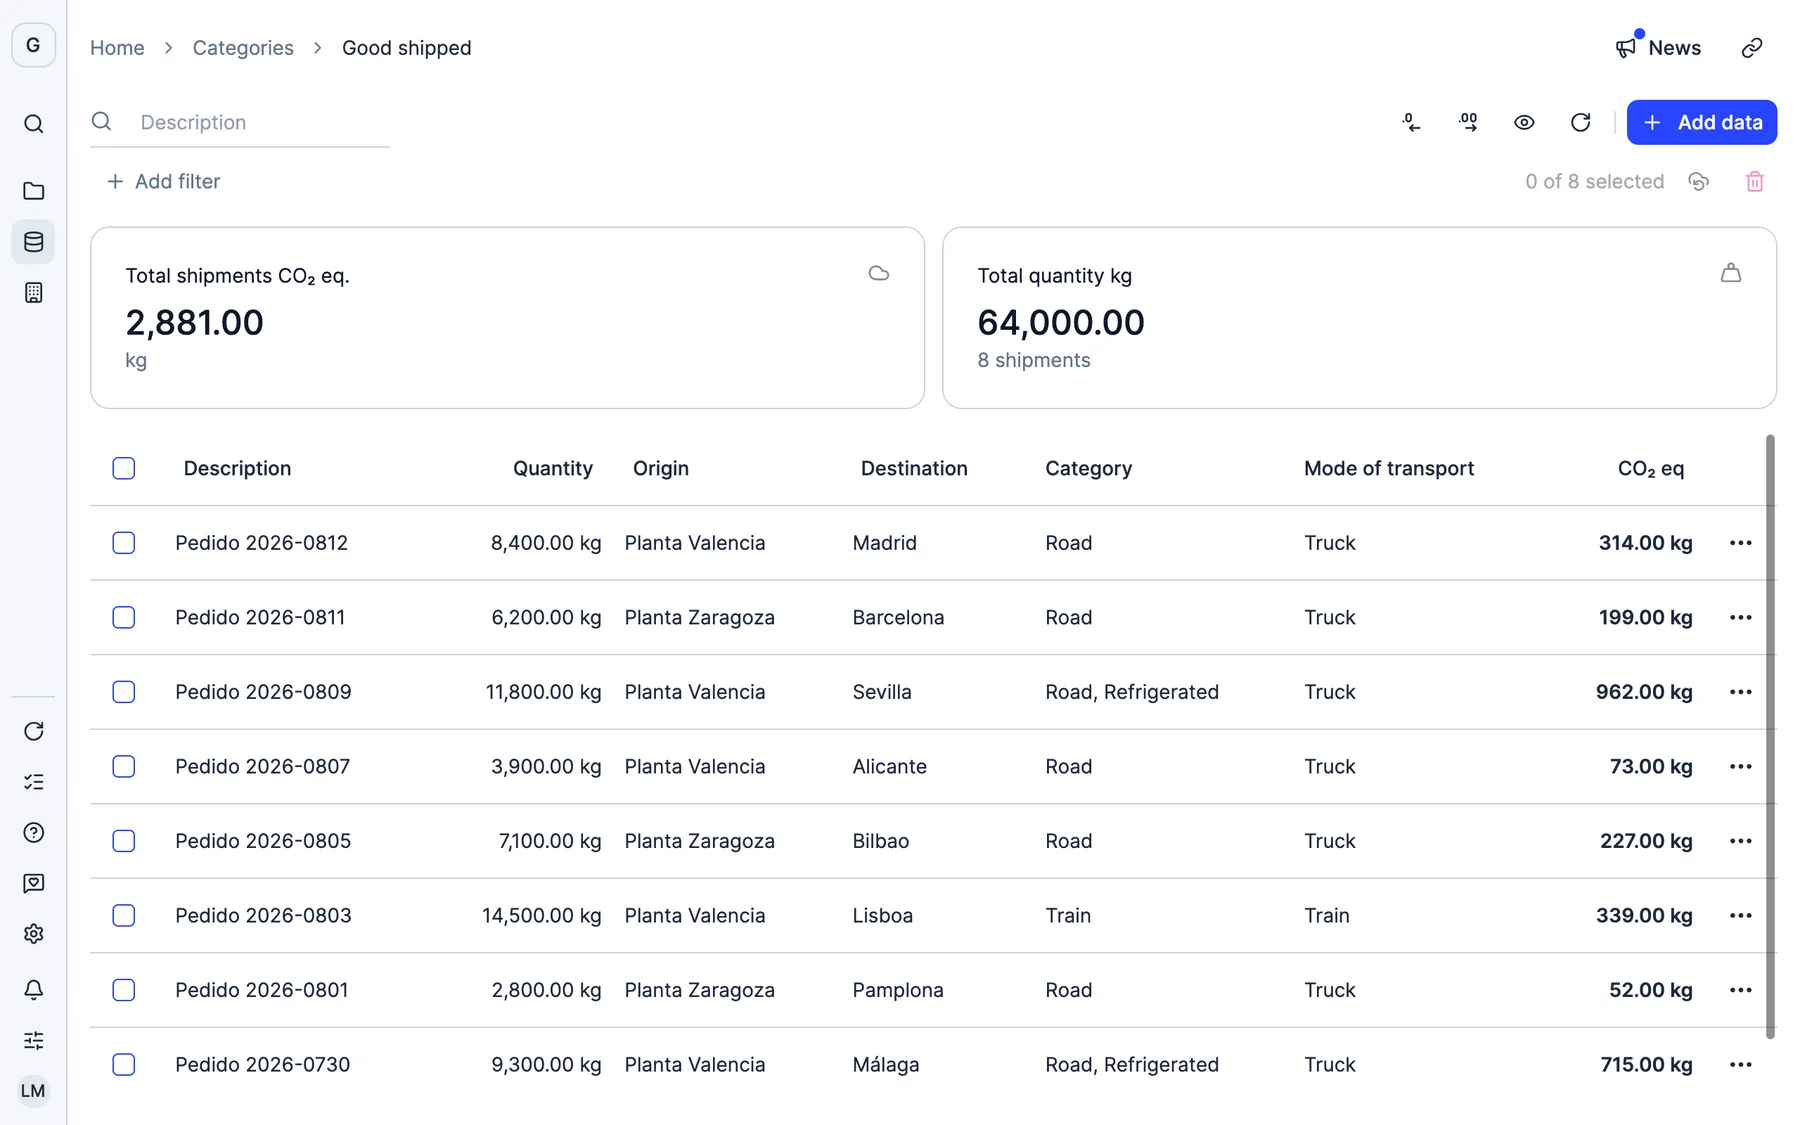
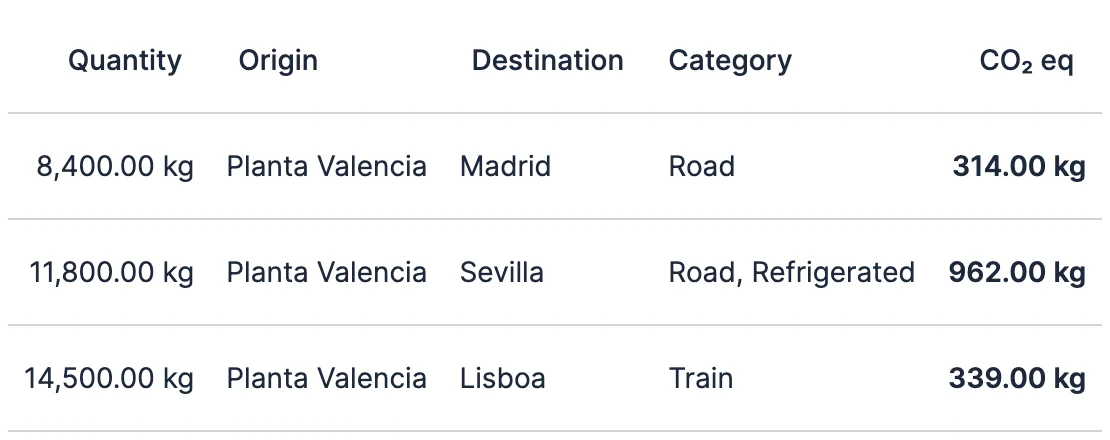
Lisbon by rail: 14.5 t and 339 kg of CO₂. Seville by refrigerated truck: 11.8 t and 962 kg. With every shipment measured, you choose the route on data.
Every category against last year: purchased electricity down 30%, downstream transport up. You see which measure paid off and where to act now.
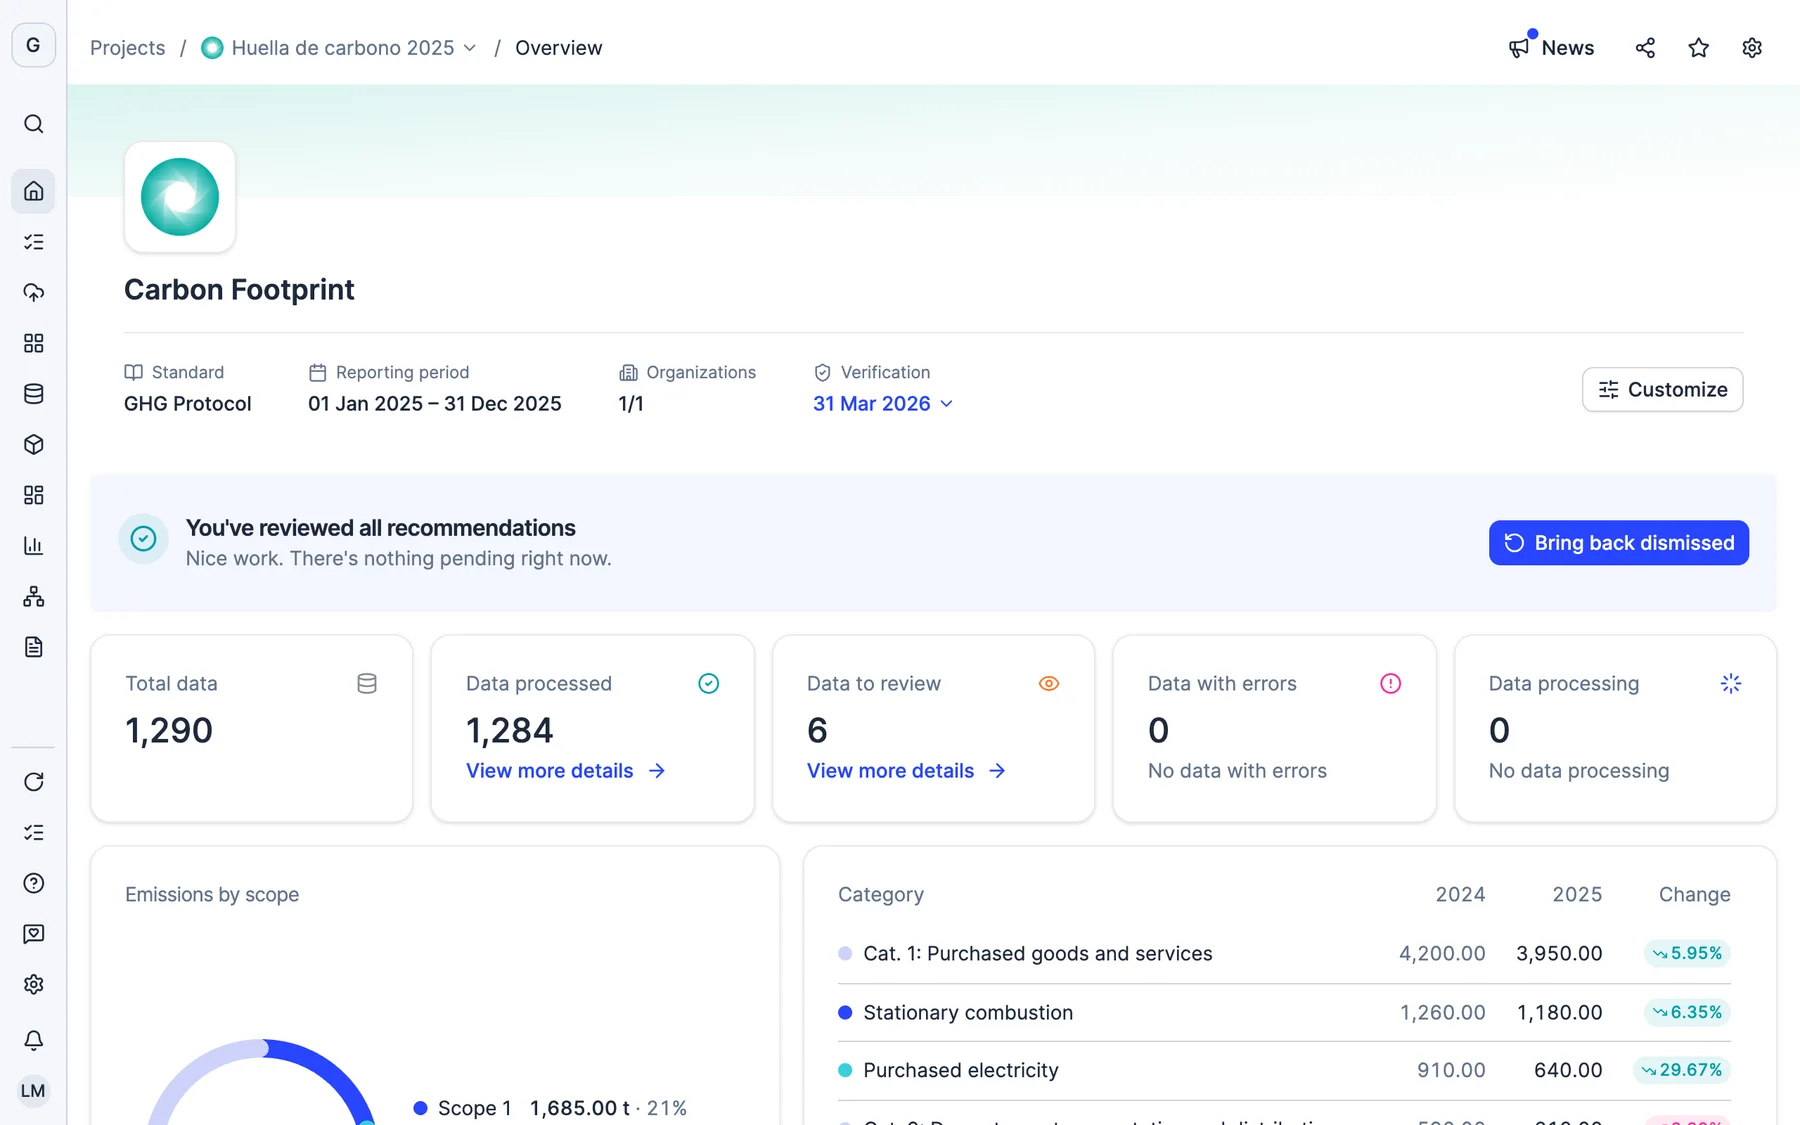
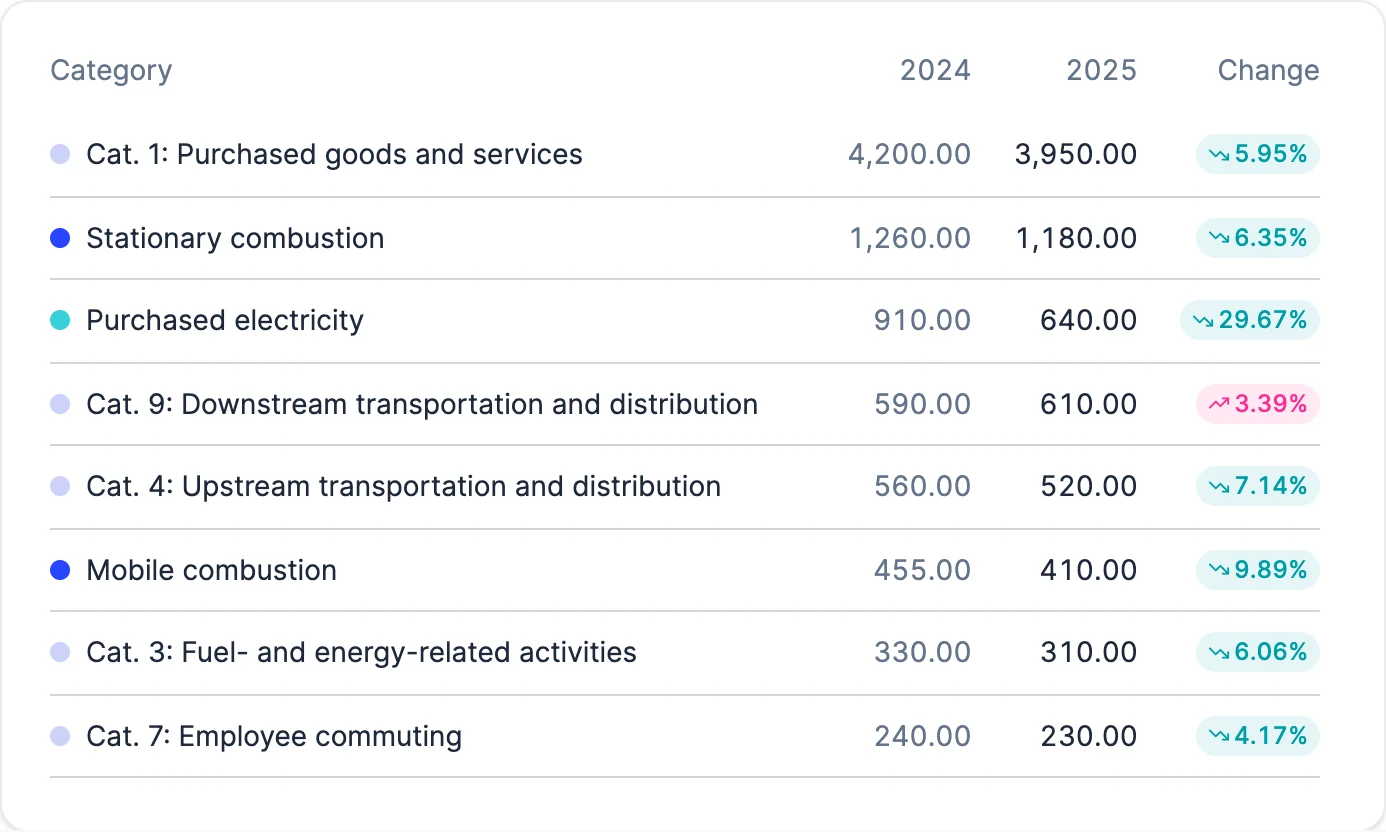
Real screens of Dcycle with the data of a made-up company.
The data you load for your own work completes other teams’ data. Together they answer questions none of them could alone.
Knows how it runs.
Knows what it costs.
Knows what was signed.
Plant C pays 23% more for the same power, and the contract renews in March.
 Monells
“We've gone from spending more than 100 hours a year on data collection to having a system that does it automatically and allows us to focus on what really matters: reducing our impact.”
Yolanda CarazoManager at Monells
Read the caseERPs such as SAP, Sage and Dynamics, travel tools such as TravelPerk, and invoices and spreadsheets. The integrations page lists the current connectors.
Yes. Multi-entity management consolidates data across facilities and subsidiaries while each site keeps its own view.
Yes. Dcycle supports ISO 14001:2026 environmental management with the same data used for the footprint, so the management system and the reports do not drift apart.
Only the people you choose. Roles and permissions let a site manager see and validate their own site without access to the rest.
We are ISO 27001 certified, GDPR compliant and data is hosted in the EU. Roles and permissions decide who sees and edits each data set, and the security documentation is public.
security.dcycle.io →The platform automates collection and calculation, and our advisors help you get started and with every report, so nothing is left behind.
Expert guidance →And if your question isn’t here, we answer it in the demo.
How the 30 minutes go
ISO 27001 · GDPR · Hosted in the EU · No commitment
Pick a day and time