

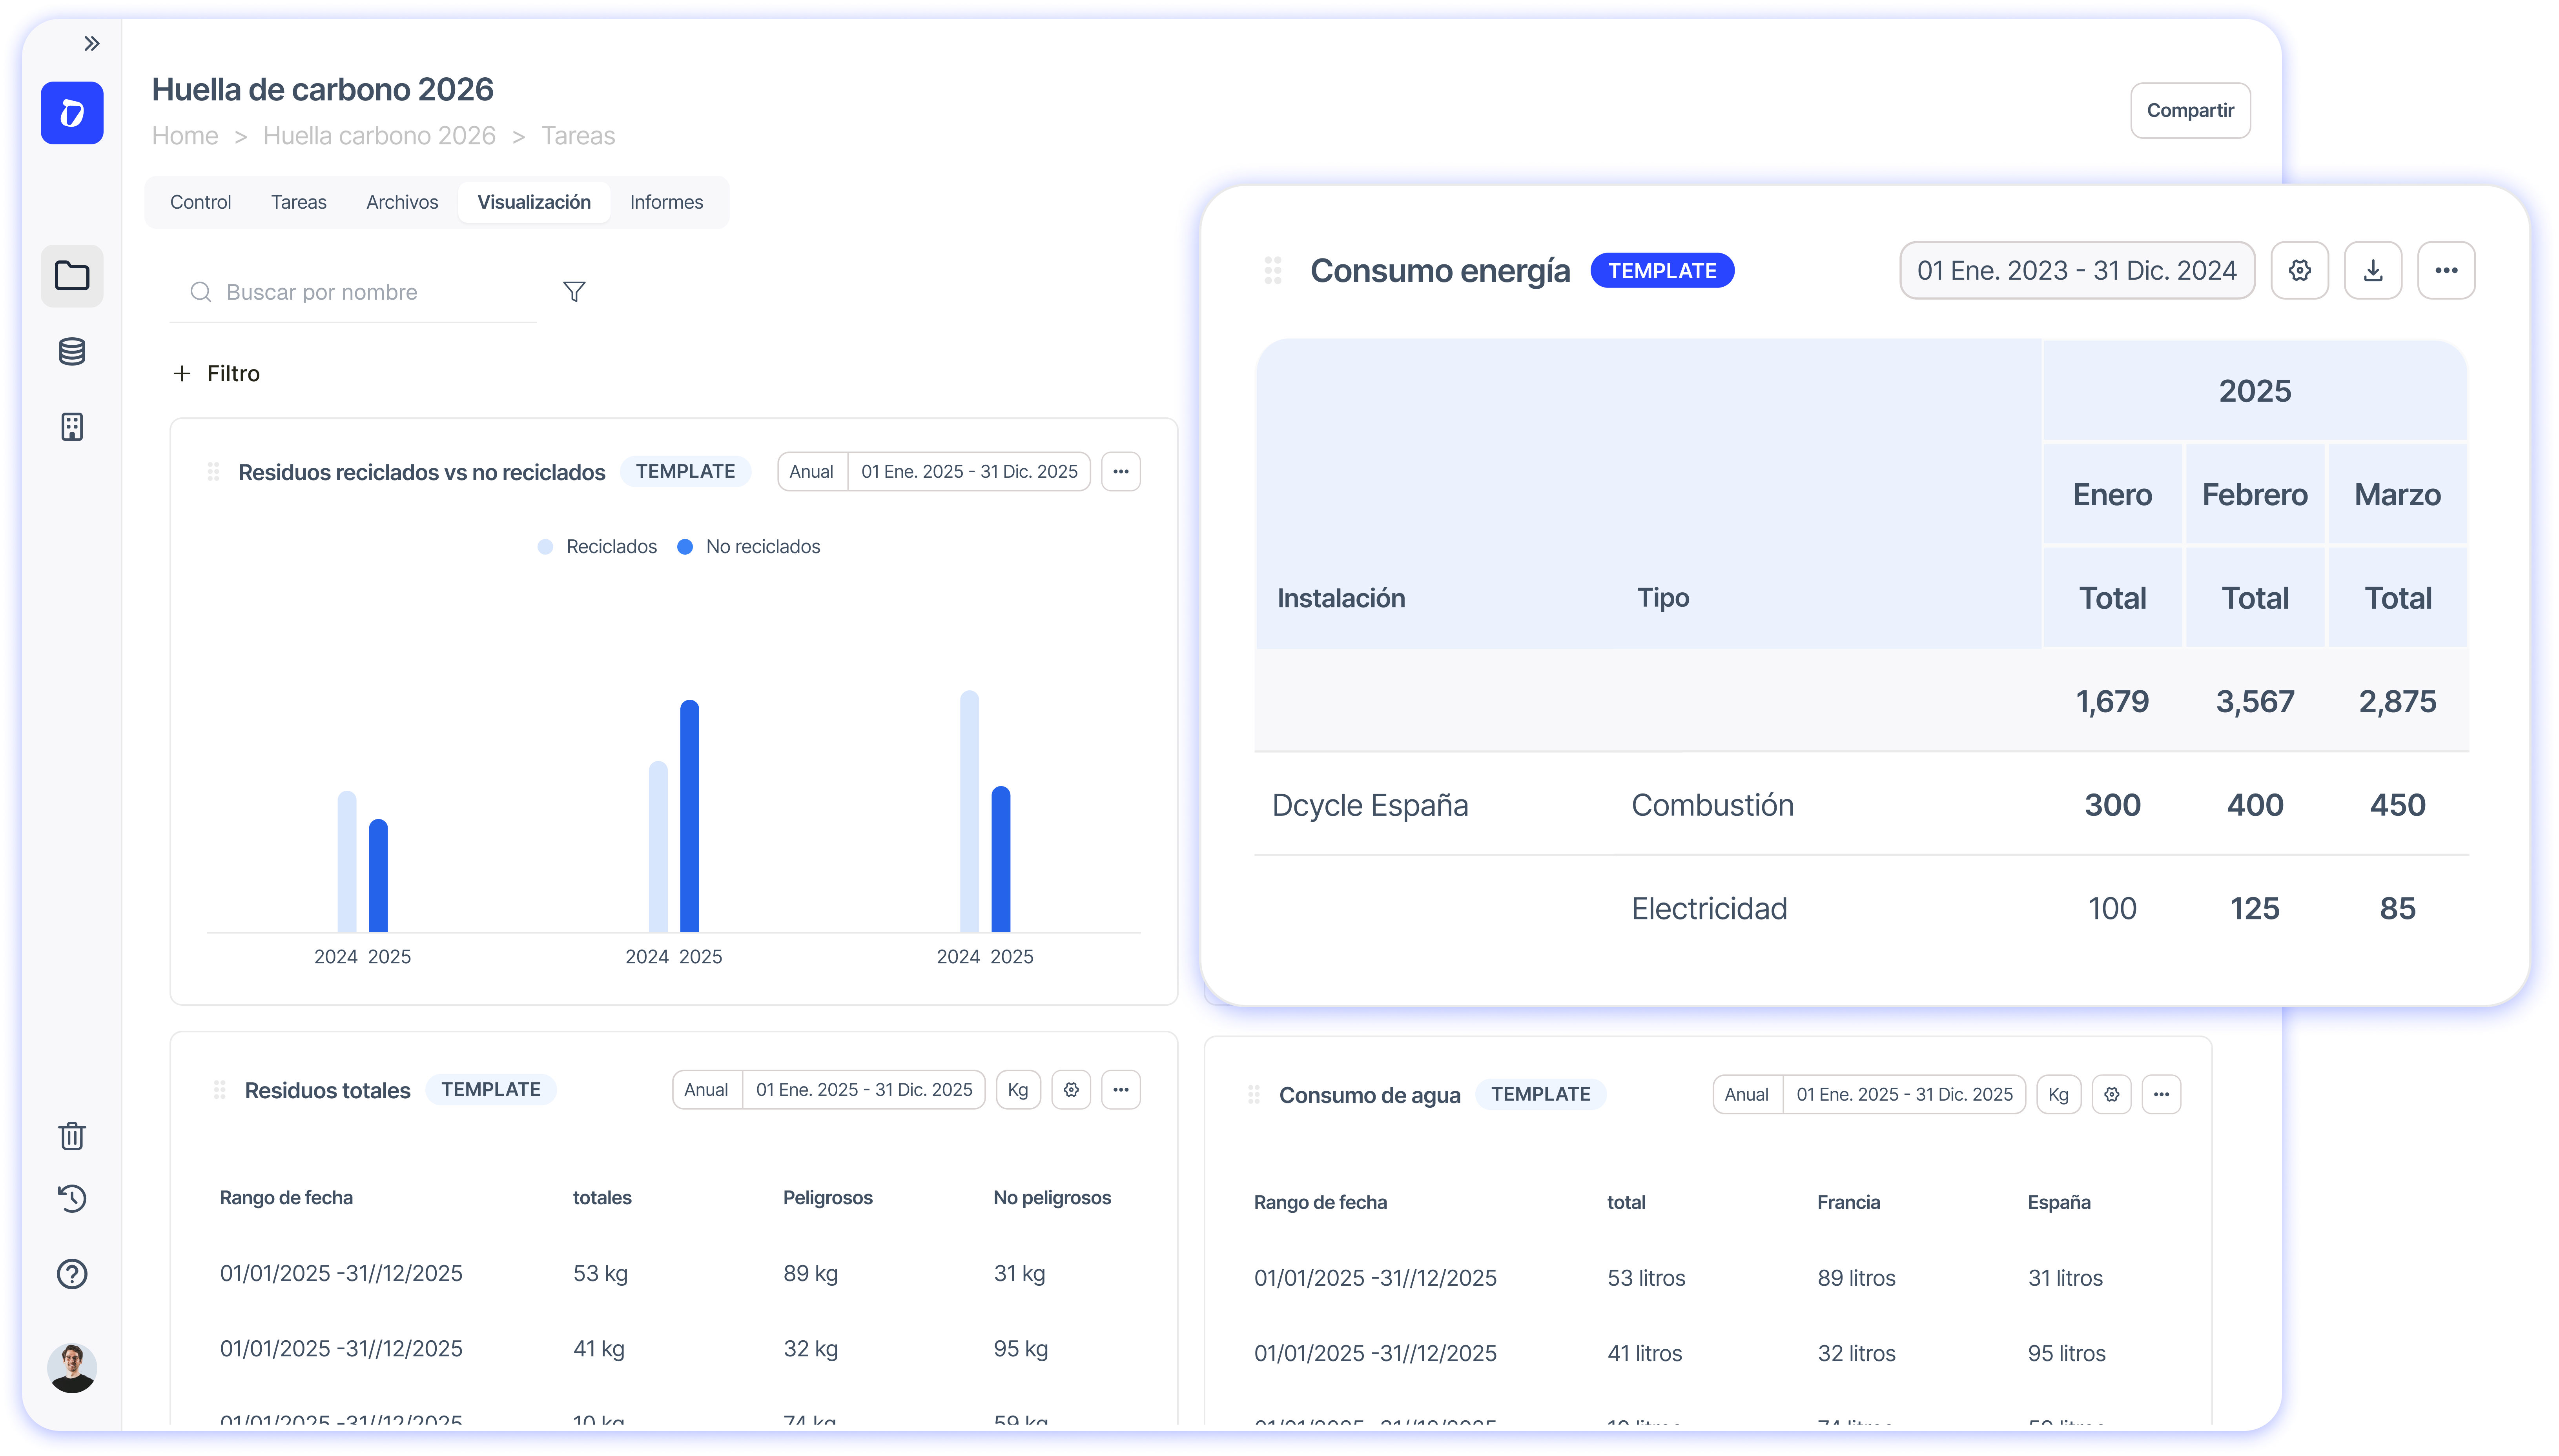
If it takes you a long time to generate the tables included in carbon footprint or sustainability reports, you’ll get a lot of value from this new improvement.
Default Visualisations
When you create a new project, the visualisations required for the report are automatically generated. This way, you’ll always feel prepared because:
- The visualisation results update automatically when you upload and process data.
- You won’t need to spend time configuring the visualisations.
- You can review results with flexibility and detail before reporting.
How it works
Simply create a project and go to the Visualisations tab. You’ll see different visualisations depending on the project type:
- Carbon Footprint: 1 pivot table with emissions in GHG Protocol format
- EINF (both methodologies: EINF-ESRS): Remember, you can always modify the visualisations using the ⚙️ button or continue creating new ones!