
Analytics

From raw data to a chart your board reads.

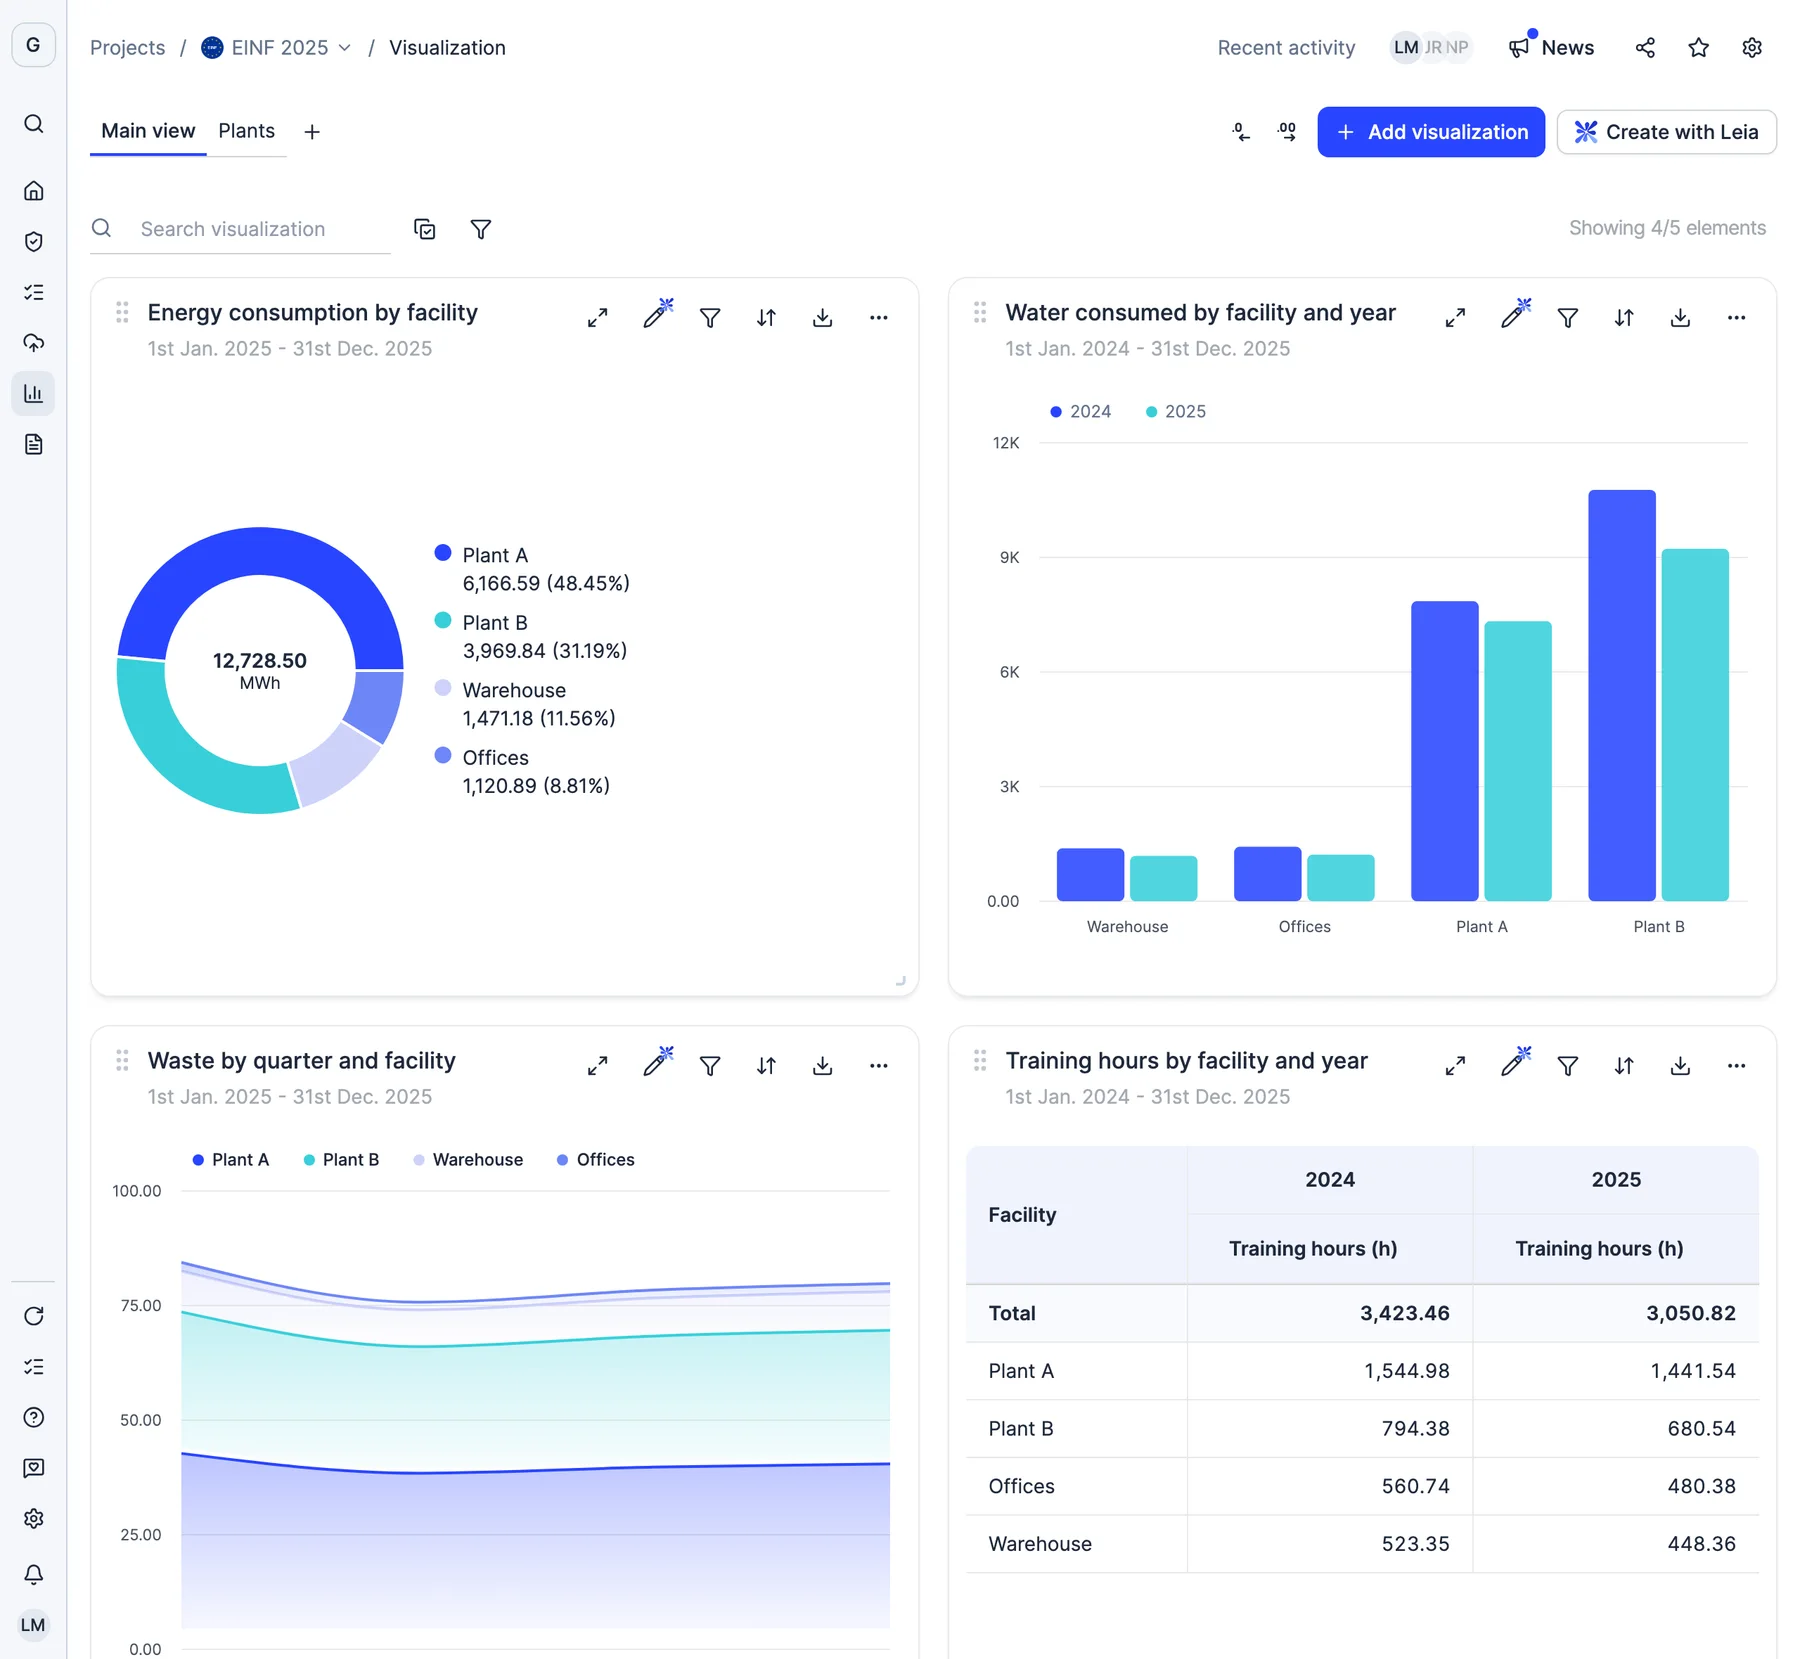
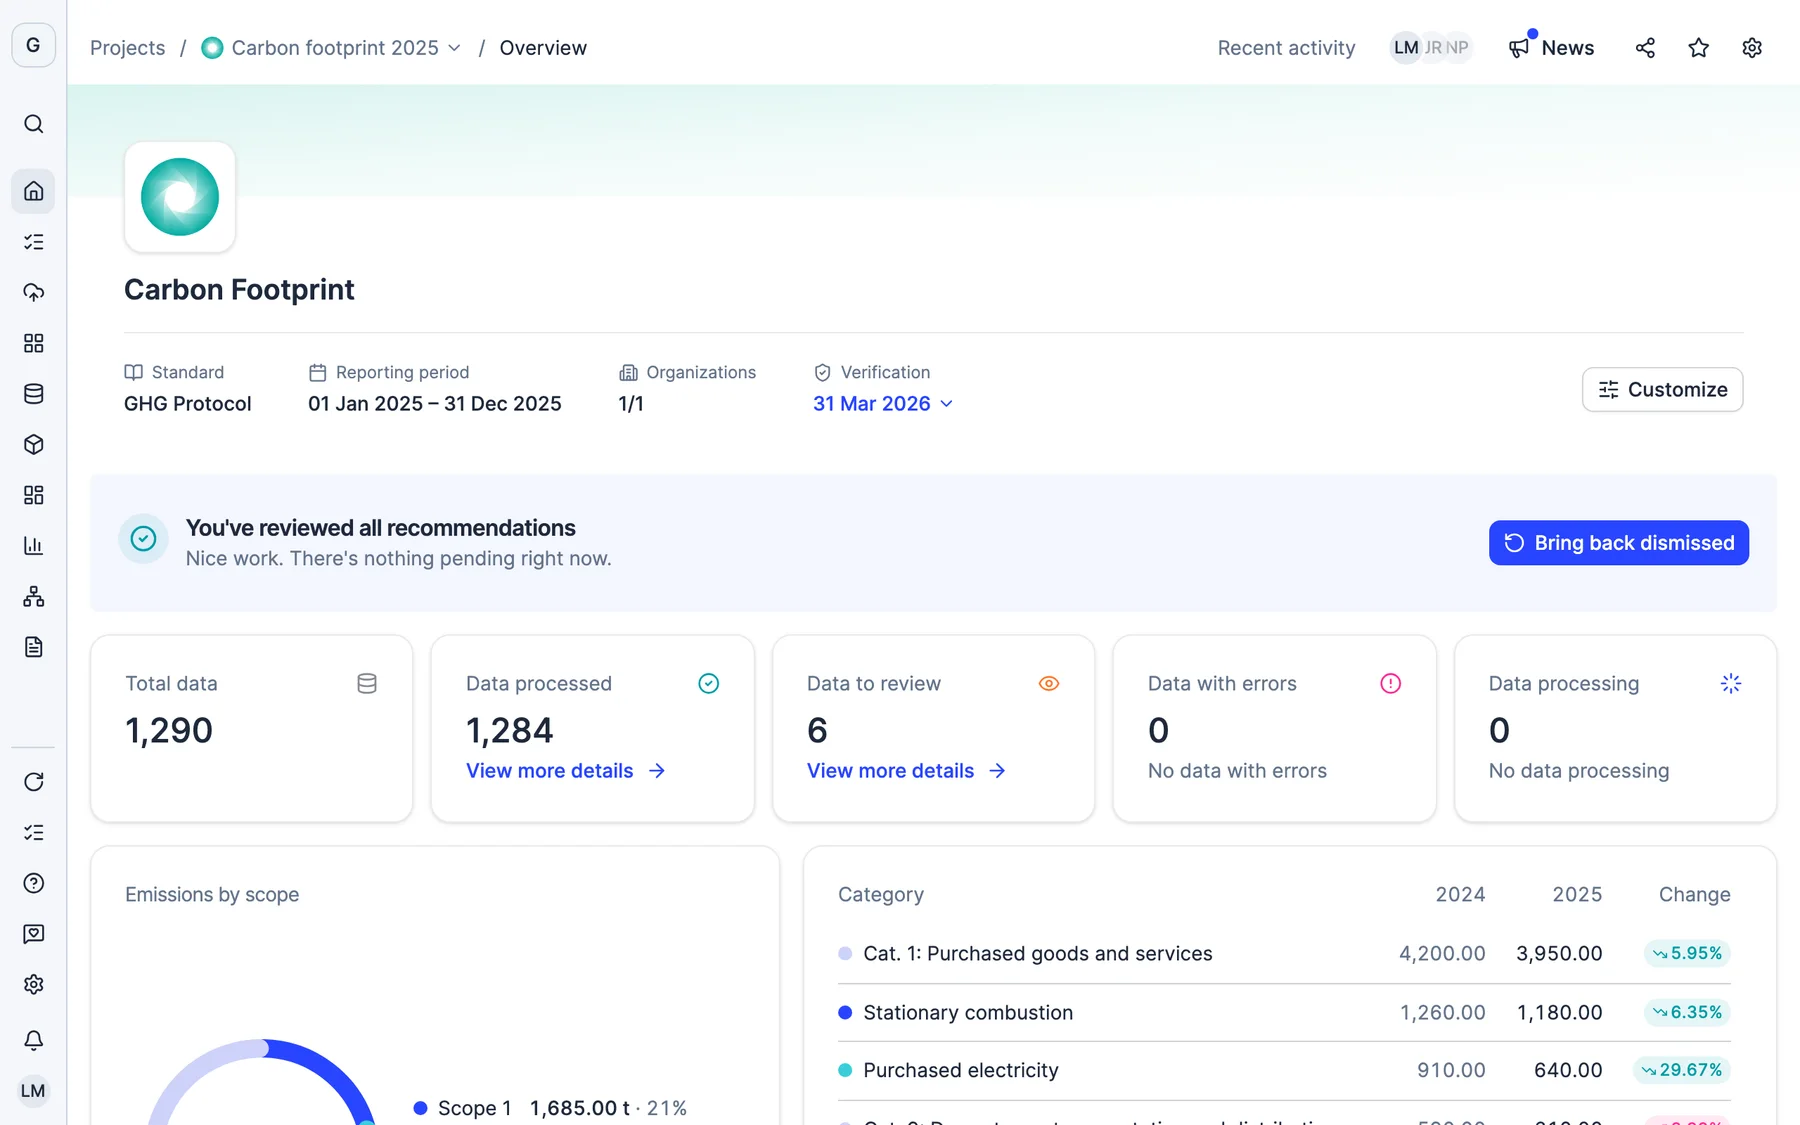
Your data no longer just sits in Dcycle. Build charts, tables, KPIs and comparisons in minutes, describe what you need and let Leia build it, then add the result to a report for your team or your auditor. And when you do want the raw numbers, download them as Excel or CSV in one click.

Request a demo
Analytics
EmissionsTargetsCoverage
Monthly emissions trend
2026
2025
Jan
Feb
Mar
Apr
May
Jun
SBTi aligned target: -42% by 2030
On track: 12% reduction achieved so far
29%

Trusted by 2,000+ companies across Europe and North America, from SME to enterprise

ABB
Ajinomoto
Eiffage
KLN
Sabadell
Valeo
Minutes, not a data pull

from the question to a chart you can put in front of the board.

From data to decision

Analyse where the data already lives

Build the view you need, not the one you were given

A visualisation builder inside the platform: charts, tables, KPIs and comparisons, on top of the data you already collected. No exporting to a spreadsheet, no rebuilding the same pivot table every quarter, and no gap between the number in the chart and the number in the report.

Emissions by year−18% vs. previous year
FY 202312,840 tCO₂e
FY 202410,530 tCO₂e
2023
2024−18%
Scope 1Scope 2Scope 3
Hotspot A374%of total emissions

Describe it and Leia builds it

Tell Leia the chart you need in plain language and it builds it for you. Leia already classifies incoming records and flags month over month shifts worth a closer look, so the analysis starts from something that has been read rather than from an empty canvas. Every suggestion stays editable.

Trends & PatternsAI analysis
Top contributorElectricity42% of total emissions
YoY trend-12.3%vs. same period 2025
1
Madrid HQ — Electricity42% of total · Seasonal peak Jul-Aug
2
Barcelona — Natural Gas28% of total · +8% vs. last year
3
Fleet — Diesel18% of total · -23% after optimisation

From insight to finished report in one step

Once you have the view you want, add it directly to your report. The chart your team discussed on Monday is the chart the auditor sees, because it is the same object on the same data, not a screenshot pasted into a document.

Reports by Level
Download
GHG Protocol logo
Group Carbon FootprintAll entities · 486 tCO₂e
Ready
CSRD logo
CSRD — ConsolidatedGroup level · ESRS E1-E5
Ready
ISO 14064 logo
ISO 14064 — Madrid HQFacility level · Scope 1-2-3
Ready
EcoVadis logo
EcoVadis — GroupGroup level · Environment section
92%
One data entry → Every report, every level

Take the underlying data with you

Download your data as Excel or CSV in one click. Scope 1 and 2 exports come by individual category, heat, electricity, recharge and vehicles, include the monetary amounts associated with each record and not just the emissions, and let you set a custom start and end date instead of a full calendar year.

Dashboard
FY 2026Export
Total emissions
1,284 tCO₂e
-12% vs LY
Data coverage
87%
Frameworks
4 active
CSRDGHGISOCDP
Emissions by scopetCO₂e
Scope 1
Scope 2
Scope 3
Emissions by year−18% vs. previous year
FY 202312,840 tCO₂e
FY 202410,530 tCO₂e
2023
2024−18%
Scope 1Scope 2Scope 3
Hotspot A374%of total emissions
Trends & PatternsAI analysis
Top contributorElectricity42% of total emissions
YoY trend-12.3%vs. same period 2025
1
Madrid HQ — Electricity42% of total · Seasonal peak Jul-Aug
2
Barcelona — Natural Gas28% of total · +8% vs. last year
3
Fleet — Diesel18% of total · -23% after optimisation
Reports by Level
Download
GHG Protocol logo
Group Carbon FootprintAll entities · 486 tCO₂e
Ready
CSRD logo
CSRD — ConsolidatedGroup level · ESRS E1-E5
Ready
ISO 14064 logo
ISO 14064 — Madrid HQFacility level · Scope 1-2-3
Ready
EcoVadis logo
EcoVadis — GroupGroup level · Environment section
92%
One data entry → Every report, every level
Dashboard
FY 2026Export
Total emissions
1,284 tCO₂e
-12% vs LY
Data coverage
87%
Frameworks
4 active
CSRDGHGISOCDP
Emissions by scopetCO₂e
Scope 1
Scope 2
Scope 3

Additional features

See how Dcycle compares to the alternatives

Your choice Manual process Legacy tools

Charts, tables and KPIs

Four building blocks, one dataset. Pick the shape that answers the question instead of forcing every answer into a table.

Leia as your analyst

Describe the chart, get the chart. Leia also surfaces the top contributor and the shifts worth investigating on its own.

Year on year comparisons

Put a period next to the same window a year earlier, broken down by company, facility and emission category.

Charts into reports

Send any view straight into an editable report, where it stays a chart on export instead of collapsing into a table.

Excel and CSV export

One click for the underlying rows, including monetary values, so the data is reusable well beyond ESG reporting.

Custom date ranges

Export a quarter, a month or any window you choose, per category, instead of being locked to the calendar year.

“Dcycle helped us consolidate 6 facilities across 2 countries into a single source of truth. Our auditors couldn't believe the level of traceability.”
Lina Pena Corp. Services Director, KLN Iberia
“I see your help as super necessary, I can't imagine maintaining the contract without your advisory component. We went from scattered spreadsheets to a unified system in weeks.”
Yolanda Carazo Environmental Manager, Embutidos Monells
“Our investors value our ESG commitment. Dcycle made us a reference in the financial sector, we can respond to any audit or client request instantly.”
Teresa de Vicente Sustainability Lead, Finsolutia

Data and reporting resources

View all resources

Dictate to Leia with your voice

You can now dictate your questions to Leia: hit the mic, talk, and what you said appears as text in the chat, ready to review and send.

Read more

Frequently asked questions

What can I build with Analytics?

Charts, tables, KPIs and comparisons, from the data already in your Dcycle projects. It is a visualisation builder rather than a fixed set of dashboards, so the view follows the question you are trying to answer: emissions by facility, intensity per unit produced, a category against the same quarter last year, or a single number you want on a slide.

Do I have to export to a spreadsheet to analyse my data?

No, and that is the point. The analysis happens on the data where it lives, so there is no gap between the figure in your chart and the figure in your report. The export is still there when you want the raw rows for something else, it is just no longer the only way to get an answer.

Can Leia build a chart for me?

Yes. Describe what you need in plain language and Leia builds it. Leia also does the first pass on your data on its own: it classifies incoming activity records, shows its confidence, and flags month over month movements worth a closer look. Everything it produces stays editable.

Can I put a chart into a report?

Yes, in one step. Any view you build can go straight into an editable report for your team or your auditor, and it stays a chart when the report is exported to Word or PDF instead of collapsing into a table.

What exactly can I export?

Your data as Excel or CSV in one click. Scope 1 and 2 data can be downloaded by individual category, heat, electricity, recharge and vehicles, rather than as one large file, and each download includes the monetary amounts tied to those records alongside the emissions figures. You can also set a custom start and end date.

Does it work on custom data too?

Yes. Anything you store through custom categories and fields can be charted, tabled or turned into a KPI in the same way as native compliance data. That is much of the reason for storing it in Dcycle rather than in a separate file.

Does this replace our BI tool?

Not for a company that already runs one, and we would not claim otherwise. What it replaces is the round trip a sustainability team makes to answer its own questions. If you do have BI, the MCP Server and the API expose the same data to it, so Analytics and your warehouse are reading one source rather than two.

Can I compare this year with last year?

Yes. Comparisons are one of the building blocks, and the pre-audit report also ships a year on year chart that totals emissions for the audited period next to the same calendar window a year earlier, broken down by company, facility and category. It is a fast way to catch a data gap before an external auditor does.

Collect once. Use everywhere.

See how Dcycle cuts reporting time by 70%, surfaces operational savings, and gives your auditors what they need, the first time.

See Dcycle in action