
Sustainability
New custom attributes to classify your data
 · · 1 min read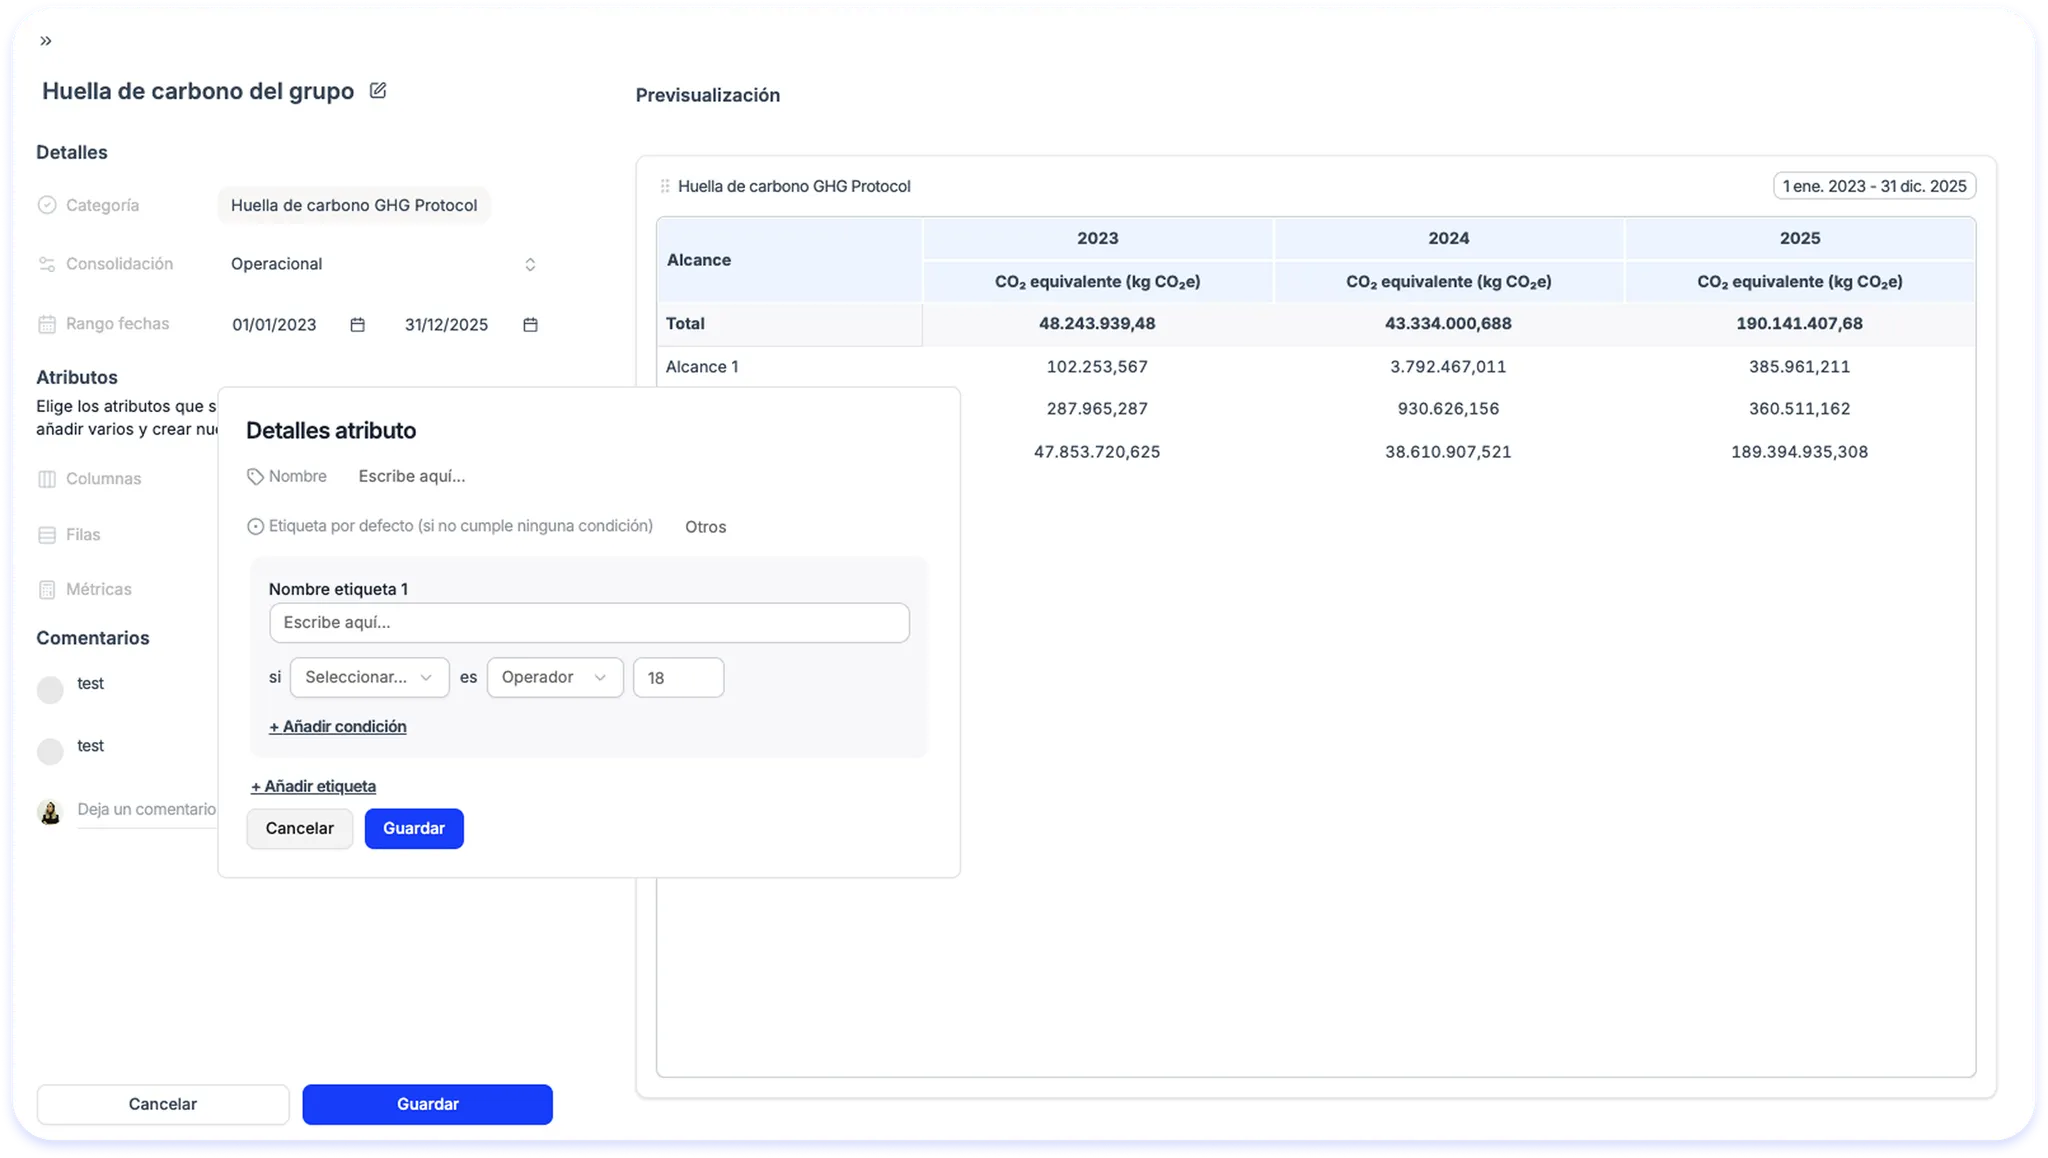
Related articles
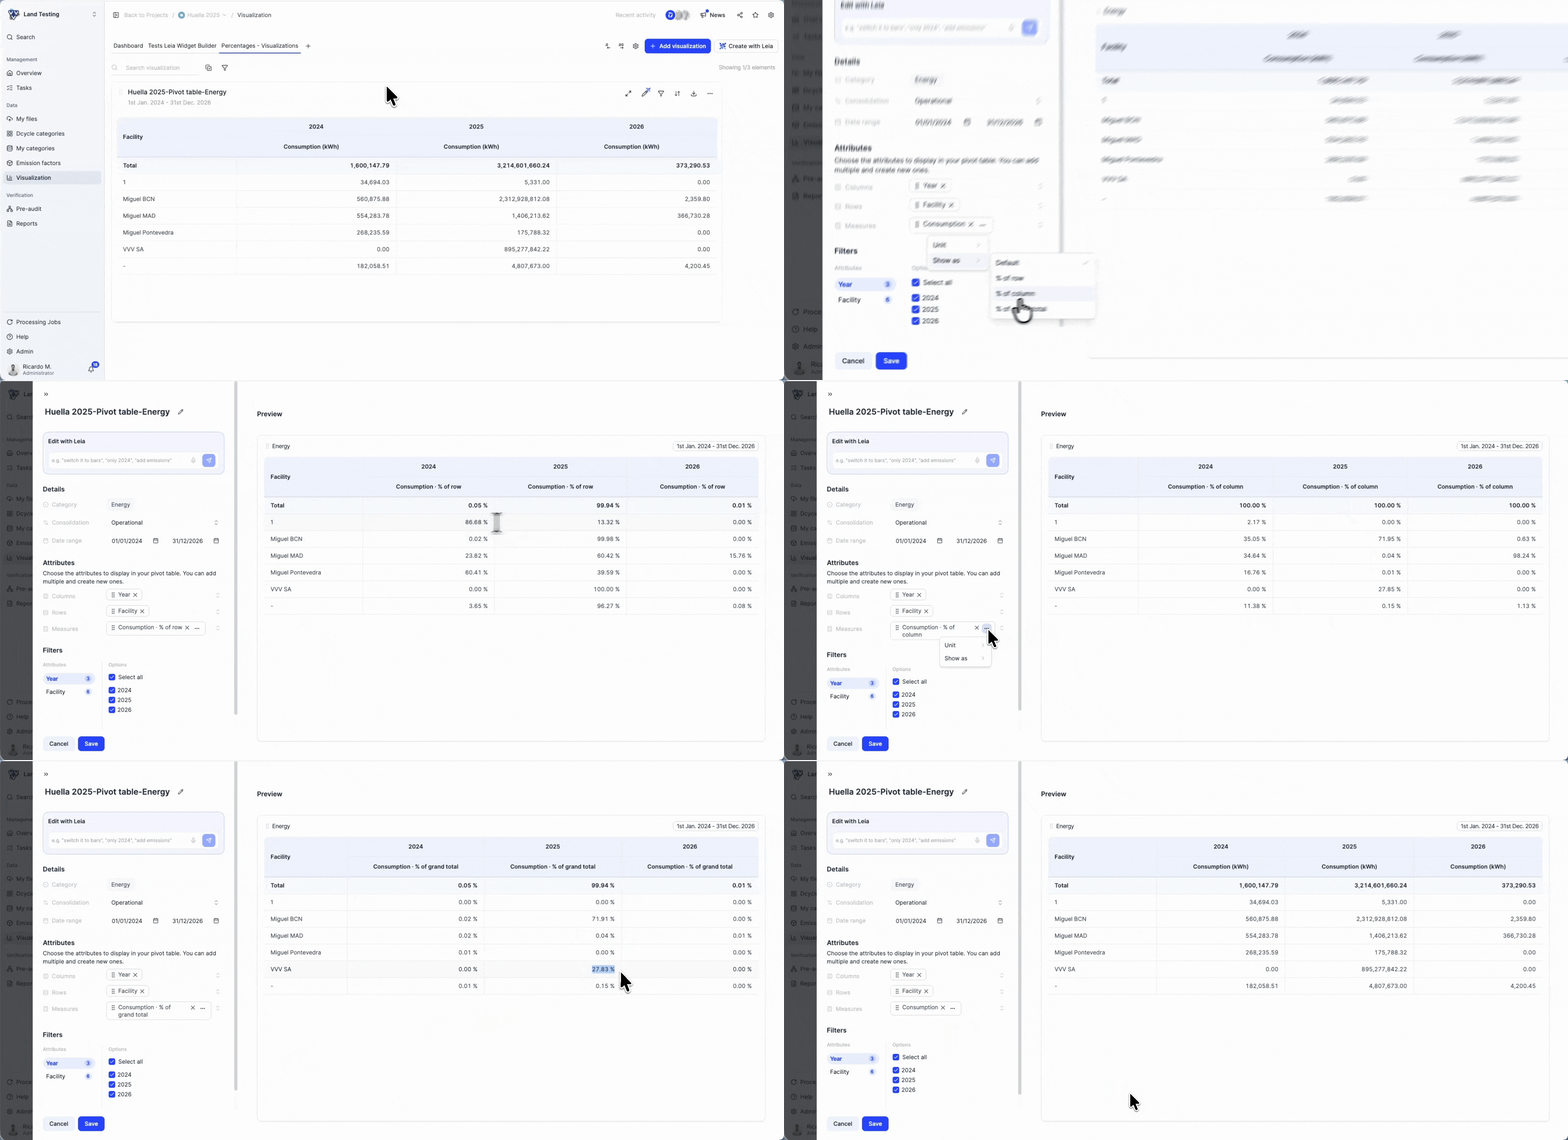
See any metric as a percentage in your visualizations
Comparing consumptions, emissions, expenses or identifying hotspots is easier than ever!
Read more
Da a cada rol exactamente el acceso que necesita
Los roles ahora se pueden limitar a empresas participadas, centros y categorías personalizadas específicas -no solo categorías Dcycle-, para que los
Read more

Give roles exactly the access they need
Roles can now be scoped to specific investees, facilities, and custom categories - not just Dcycle categories - so admins can grant exactly the access a
Read more 30-minute demo
See it with your own data.
Thirty minutes with our team. We show you how your data would come in, and what you would get out.
See Dcycle in action- No commitment
- With your data
- In your language
What your session looks like
- 01 You tell us what you reportFrameworks, deadlines and who asks for it. 0–5 min
- 02 We show how your data comes inInvoices, ERP, suppliers: on an example close to yours. 5–20 min
- 03 You leave with a planWhat to automate first and how much time you save. 20–30 min



 With someone from the team who then supports you