
What’s new
If you manage a group of companies in Dcycle, you can now control which project visualizations are visible to your child organizations. Previously, the Visualization tab was completely blocked for organizations accessing projects from their parent company. With this update, each project includes a new setting that lets you enable or disable visualization access on a per-project basis.
When you turn it on, all child organizations in your group (including those several levels down) can view the project’s dashboards, charts, and tables in read-only mode. They cannot modify, add, or delete any visualization, ensuring your original data and configurations remain untouched.
How it works
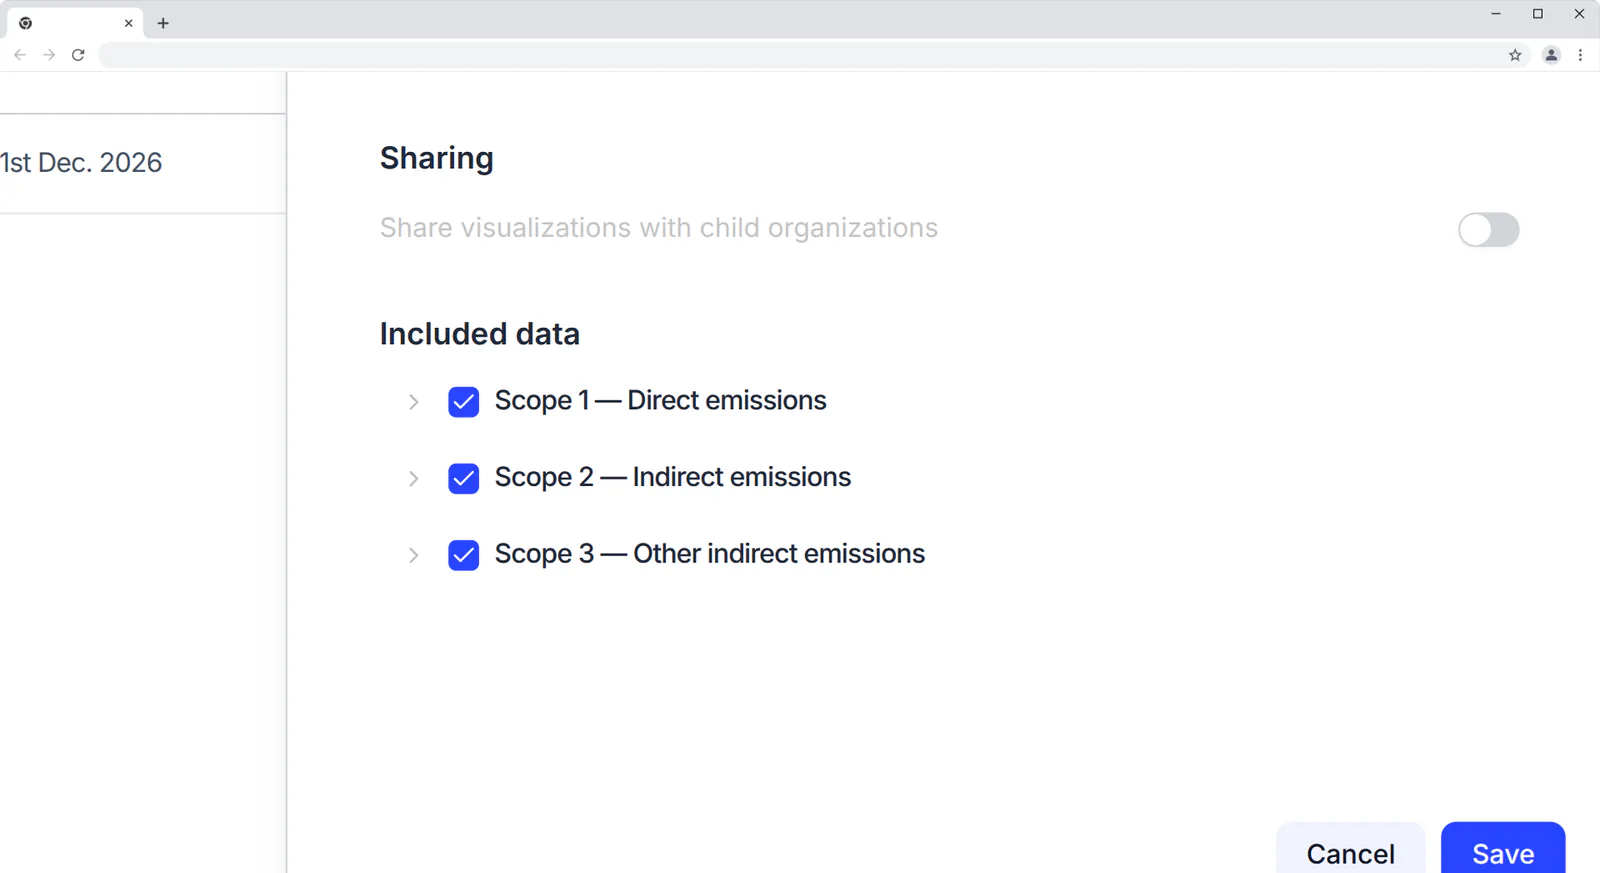
The new setting lives in each project’s configuration, under the “Sharing” section. You will find a toggle called “Share visualizations with child organizations”. It is off by default, so no existing project changes behavior.
To enable it:
- Open your project from the owning organization
- Go to project settings (gear icon or settings page)
- In the “Sharing” section, turn on the toggle
- Save your changes From that point on, any user in a child organization who accesses the project will see the Visualization tab unlocked. They can navigate between dashboard tabs, apply filters, and explore all widgets, but they will not have access to any editing controls.
If you ever want to revoke access, simply turn off the toggle and child organizations will see the tab blocked again.
Why it matters
This feature addresses a common need in corporate groups: sharing sustainability analytics and metrics with subsidiaries without compromising control over the data. Instead of duplicating dashboards or manually exporting reports, the parent organization can provide direct access to its visualizations knowing that no one can alter the original configuration.
It is especially useful for holdings that consolidate the carbon footprint of multiple subsidiaries and want each one to review aggregated results without having to recreate them in their own account.